Text Recognition to Read Rasterized Plots
Often a visualization of a plot is saved as a rasterized image. The main source of these plots are scanners, or old documents. In order to reconstruct a higher resolution plot, one should convert the rasterized plot into vector graphics. This example shows how to use image processing and text recognition to extract plot skeletons including axes, axes labels and the ranges of values in the horizontal and vertical direction.
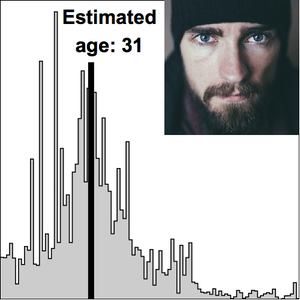
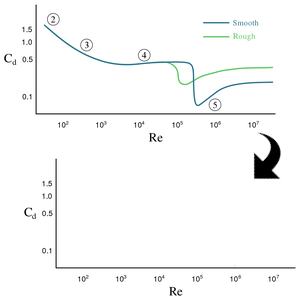
Take an image that contains a plot.
Recognize the location and recognition of all ticks and labels and store them in an association.
Now define utility functions to select nearby recognized labels and group them based on their x and y coordinates.
This let's us group the recognition to vertical and horizontal labels and ticks.
Find where the plot is on the image by creating a rectangle using the highest coordinates of on the vertical and horizontal axes.
Highlight the graphics on the image.
Now, we look at finding and parsing the ticks.
We use a small utility to convert strings detected as ticks to numbers and sorts them.
Locate, recognize and highlight axes labels.
You are now ready to recreate the plot skeleton.
On the original image the tick for 200 is a bit shifted from zero point on the horizontal axis. If you find how much the shift is, you can replicate it on the plot skeleton.
First, you need to find out how far the horizontal ticks are placed from each-other.
Computing the mean of the distances will give you the average scale of how the ticks are placed.
To compute the scale accurately you need to find out what is the average difference between the values representing the horizontal ticks.
The last thing you need to figure out, is the distance of the first horizontal tick from the axes intersection point in pixels.
Finally, you can find the required shift.
Now the plot will have the tick for 200 shifted from the zero point on the horizontal axis, like on the original image.
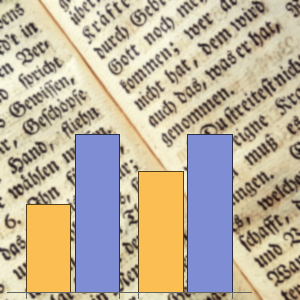
Putting all this into one function, you can try to recognize the skeleton of another plot.