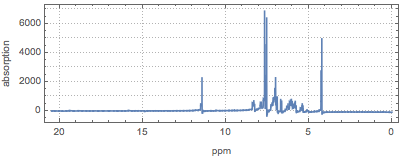
Nuclear Magnetic Resonance
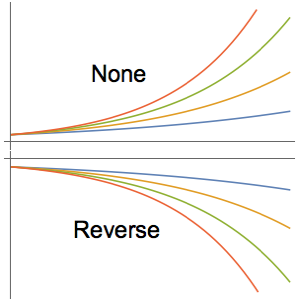
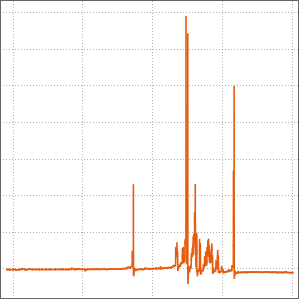
NMR data is a plot of a compound's absorption versus chemical shift. Chemical shift is given by  , where the reference frequency is defined to be 0, and the units are parts per million. Since most spectra are plotted with respect to wavelength, which is inversely proportional to frequency, NMR data is often plotted with a reversed x axis. This can be accomplished by using scaling functions.
In[1]:=
ListLinePlot[data, PlotRange -> All,
 ScalingFunctions -> {"Reverse", "Linear"},
 PlotTheme -> {"Detailed", "Wide"},
 FrameLabel -> {"ppm", "absorption"}, ImageSize -> 400]
Out[1]=