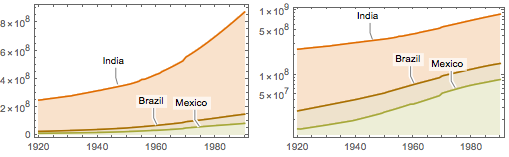
‹›Visualization: Labels, Scales, ExclusionsPopulation Growth
Use log-scaled axes to see more details about how populations change over time for countries of different sizes.
show complete Wolfram Language input
populationData = {Callout[
    CountryData["India", {"Population", {1920, 1990}}],
    "India", {Scaled[0.4], Above}],
   Callout[CountryData["Brazil", {"Population", {1920, 1990}}],
    "Brazil", Scaled[0.6]],
   Callout[CountryData["Mexico", {"Population", {1920, 1990}}],
    "Mexico", Scaled[0.8]]};
options = {ImageSize -> 250, PlotStyle -> 72,
Filling -> {1 -> {2}, 2 -> {3}, 3 -> Axis}, FillingStyle -> 72};Grid[{{
DateListPlot[populationData, options],
DateListPlot[populationData, options, ScalingFunctions -> "Log"]}}]