Fractional Coloring of a Graph
Many modern problems covering such diverse fields as webpage ranking, electronic circuit design, social network analysis and distribution management can be formulated and solved using the tools of graph theory. In addition to a large suite of functions for building, computing with and operating on graphs, the Wolfram Language includes a number of collections of graphs.
The "Graph" entity domain attempts to catalog interesting undirected graphs, together with as many of their properties as are known or can be computed. "Graph" entities provide a growing collection of more than 6,000 simple graphs and 500 precomputed properties.
The "Graph" entity framework also includes precomputed "nice" embeddings for most graphs.
Note that the objects returned by the "Graph" property are not simply graphics, but actual Wolfram Language Graph objects.
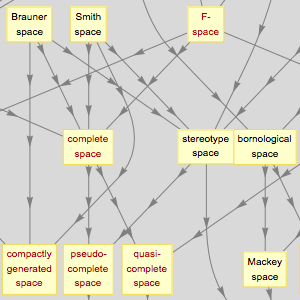
Each graph entity contains a detailed list of mathematical classes to which it belongs.
There are also two functions connecting the world of graph entities with top-level graph objects. ToEntity converts an unknown simple graph to an entity (if one exists).
The converse is provided by FromEntity (which is equivalent to using the "Graph" property).
To get an idea of the breadth of data available in the"Graph" entity domain, consider the so-called fractional chromatic number of a graph. The fractional chromatic number generalizes the usual chromatic number to the case of colorings in which multiple colors are allowed at each vertex, each with a specified weight fraction, such that adjacent vertices contain no two colors alike.
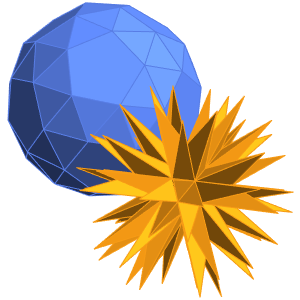
For example, while the chromatic number of the dodecahedral graph is 3 (a minimum of three colors is needed to color vertices such that no two adjacent vertices share a color), using fractional coloring gives a fractional chromatic number of 5/2 (one instantiation of which, to be discussed later, consists of five colors assigned to each node with weights of 1/2).
The graph entity domain contains both the usual and the fractional chromatic numbers for many graphs, as well as concrete colorings achieving these minimal values. For example, the dodecahedral graph has chromatic number 3.
A coloring achieving this value can be retrieved as follows.
It is quite straightforward to use this embedding and coloring data together with built-in graph functionality to create a visualization.
As can be verified visually (or programmatically), no two adjacent vertices share the same color in the preceding diagram.
The case of the fractional coloring is slightly more complicated, but essentially relaxes the constraint that each vertex have a unique color by allowing vertices to contain fractional portions of different colors. The fractional chromatic number is then defined by summing the fractional portions over all vertices. This often allows a coloring using "fewer" (though not necessarily an integer number) of colors. For example, the fractional chromatic number of the dodecahedral graph is  , which is less than its chromatic number of 3.
To obtain the fractional coloring, use the "MinimumWeightFractionalColoring" property to obtain a list of vertices and weights for different colors.
For example, the preceding output indicates that a minimal fractional coloring is possible using five colors, the first of which is applied to vertices 3, 5, 9, 12, 13, 15, 16 and 20 with weight 1/2, and so on. Since each color is applied with the same weight of 1/2, the overall fractional chromatic number is  .
.
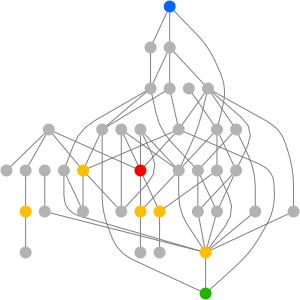
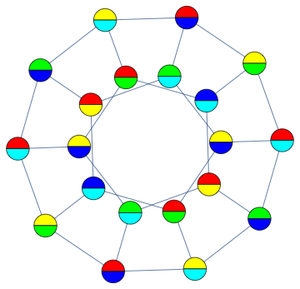
Since the fractions of each coloring are equal to 1/2 in this case, it is easy to create a visualization by first finding the two colors contributing to each vertex.
For example, the preceding list indicates that the first vertex uses colors 4 and 5, the second uses 4 and 5 as well, the third uses colors 1 and 5 and so on. Now convert numeric color indices to actual colors.
The final step in the visualization is to define a vertex shape function consisting of two appropriately colored half-disks.
With all the pieces in place, you can now display a minimal fractional coloring for the dodecahedral graph.
As expected, adjacent vertices share no common colors in this fractional coloring.
Fractional chromatic numbers are not uniformly distributed, but tend to cluster around certain values. Making a histogram using the precomputed data for all graphs in the "Graph" entity domain shows clustering around integers, though some other prominent peaks are also visible.
You can use BubbleChart to plot the numbers of graphs having each fractional chromatic number (with numerator and denominator on the  and
and  axes, respectively) and explore the distribution in more detail.