Visualize Plane Curves and Their Properties
Many plane curves and a large number of precomputed properties are available in the "PlaneCurve" entity domain.
For example, it is easy to retrieve geometric properties for parametrized curves.
Here, formal variables (drawn as letters with an underdot such as t) are used to denote function slots in properties that depend on parameters. The values at a particular parameter can then be made simply by substituting in, e.g. the following.
Visualizations of curves and their properties are also easy to make. Here, a trifolium curve is plotted using its parametric equations and the normal (green arrow) and tangent (blue arrow) at various points (red dot) along the curve are illustrated.
Similarly, one can color a curve based on a given property, such as curvature.
Here, the regions of greatest curvature are highlighted in blue, violet and red.
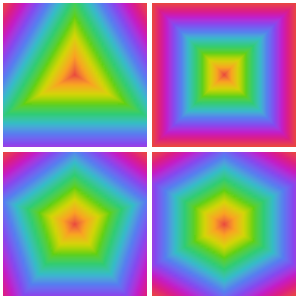
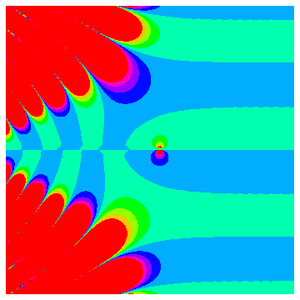
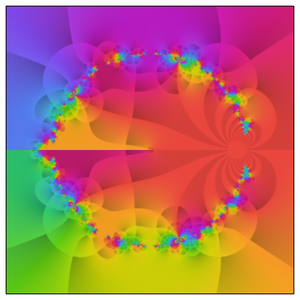
An even more colorful visualization can be obtained by starting with the well-known Cartesian equation for the circle.
Extract the portion of the equation that depends on coordinate positions, then take the radius as a scaling constant to construct level curves with the shape of a circle.
The boundary of a filled square can also be represented as a Cartesian equation.
Such representations are explicitly known to the "PlaneCurve" domain up to the hexagon.
The process of constructing such representations can be generalized to produce polygonal level curves of any desired degree.