음성 시각화
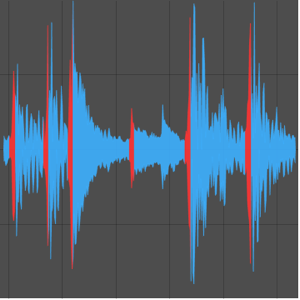
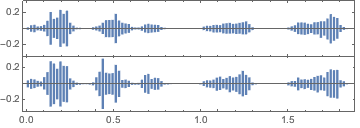
음성 신호의 파형을 시각화합니다.
In[1]:=
a = ExampleData[{"Audio", "Bird"}, "Audio"]Out[1]=
In[2]:=
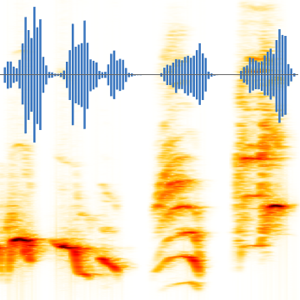
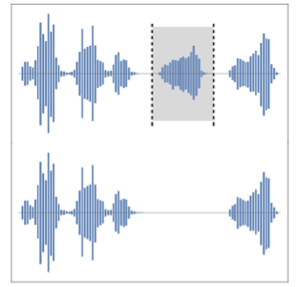
AudioPlot[a, Appearance -> "Discrete", PlotRange -> All,
 ImageSize -> Medium]
Out[2]=
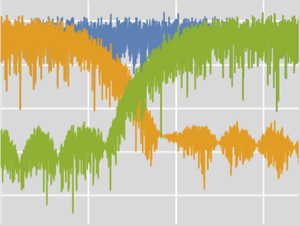
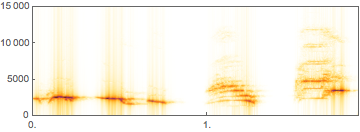
음성 신호의 스펙트럼 기록도를 시각화합니다.
In[3]:=
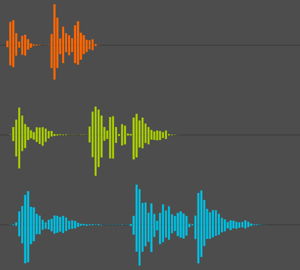
Spectrogram[a, ImageSize -> Medium, PlotRange -> {All, {0, 15000}}]Out[3]=
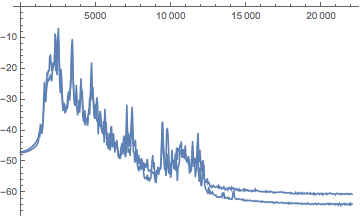
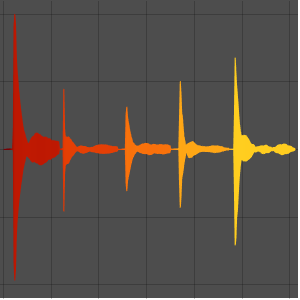
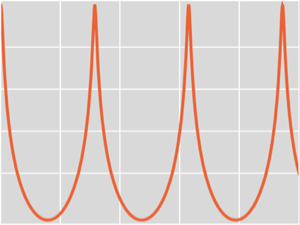
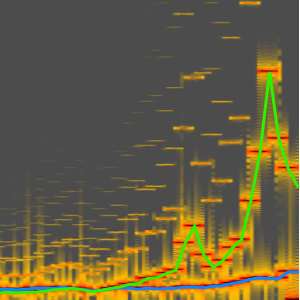
음성 신호의 파워 스펙트럼을 알아봅니다.
In[4]:=
Periodogram[a, 1000, ImageSize -> Medium]Out[4]=