Shepard's Tone: An Auditory Illusion
Create an auditory illusion.
In[1]:=
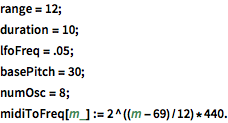
range = 12;
duration = 10;
lfoFreq = .05;
basePitch = 30;
numOsc = 8;
midiToFreq[m_] := 2^((m - 69)/12)*440.
Generate ramps to control frequencies and amplitudes of the oscillators.
In[2]:=
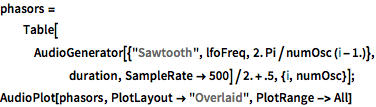
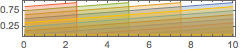
phasors =
  Table[AudioGenerator[{"Sawtooth", lfoFreq, 2. Pi/numOsc (i - 1.)},
      duration, SampleRate -> 500]/2. + .5, {i, numOsc}];
AudioPlot[phasors, PlotLayout -> "Overlaid", PlotRange -> All]
Out[2]=
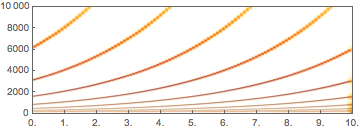
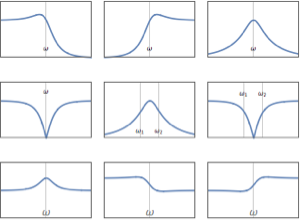
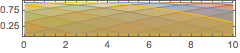
Create frequencies that will control the oscillators. The frequencies are exactly one octave apart from each other and increase exponentially, so that pitch increases linearly.
In[3]:=
freqs = Table[
   midiToFreq[(phasors[[i]])*12*numOsc + basePitch], {i, numOsc}];
AudioPlot[freqs, PlotLayout -> "Overlaid", PlotRange -> All]
Out[3]=
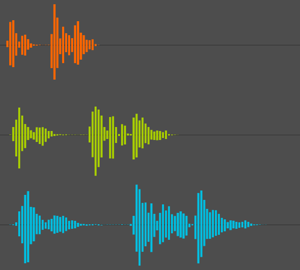
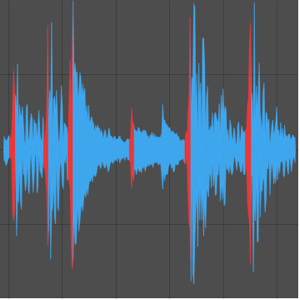
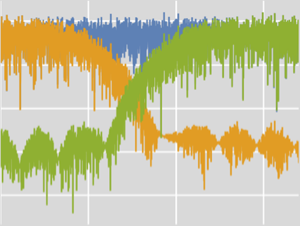
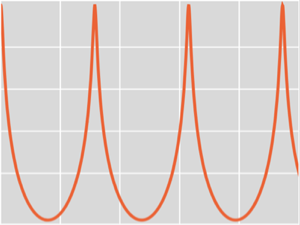
Create amplitudes that will control the oscillators. Amplitudes go to 0 when the frequencies drop to the minimum value.
In[4]:=
amps = Cos[#*Pi - Pi/2.] & /@ phasors;
AudioPlot[amps, PlotLayout -> "Overlaid", PlotRange -> All]
Out[4]=
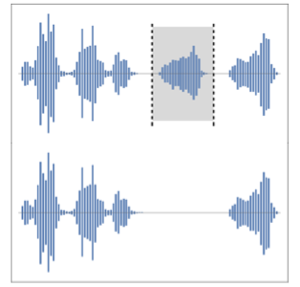
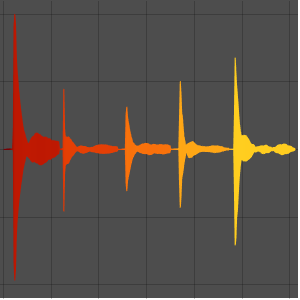
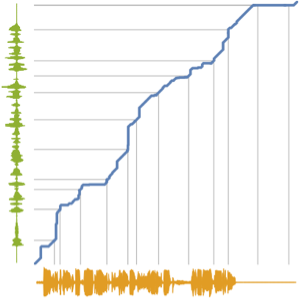
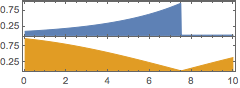
Show the relation between frequency and amplitude of one oscillator.
In[5]:=
AudioPlot[AudioNormalize /@ {freqs[[2]], amps[[2]]}, PlotRange -> All]Out[5]=
Combine a bank of oscillators using the created frequencies and amplitudes.
In[6]:=
res = Mean[
  Table[amps[[i]] AudioGenerator[{"Sin",  freqs[[i]]}], {i, numOsc}]]
Out[6]=

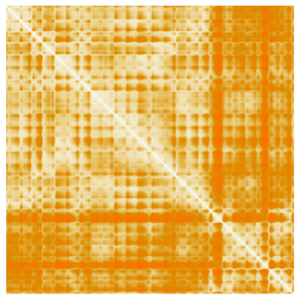
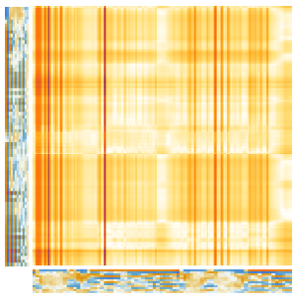
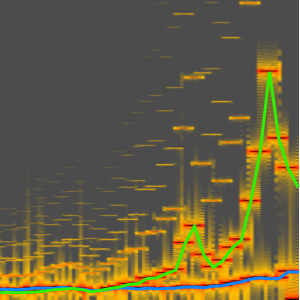
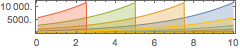
In[7]:=
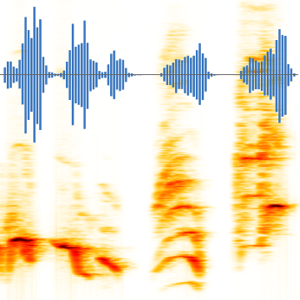
Spectrogram[res, 8192, 4096, HannWindow,
 PlotRange -> {All, {0, 10000}}, ImageSize -> Medium]
Out[7]=