Enhance Curated Datasets with Built-In Data
The extensive collection of built-in socioeconomic data in the Wolfram Knowledgebase can be used to enhance external data sources.
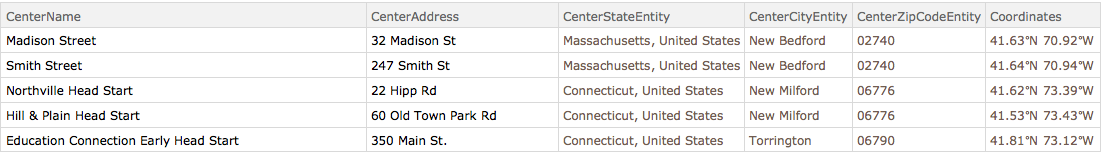
Start with a dataset of Head Start locations, imported from the US Department of Housing and Urban Development.
In[1]:=
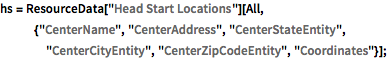
hs = ResourceData["Head Start Locations"][
   All, {"CenterName", "CenterAddress", "CenterStateEntity",
    "CenterCityEntity", "CenterZipCodeEntity", "Coordinates"}];
In[2]:=
Take[hs, 5]Out[2]=
Use a selection operator to extract a subset of locations.
In[3]:=
hsChicago =
hs[Select[#CenterCityEntity ===
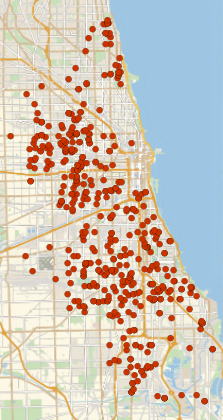
Entity["City", {"Chicago", "Illinois", "UnitedStates"}] &]];Represent them on a map of Chicago.
In[4]:=
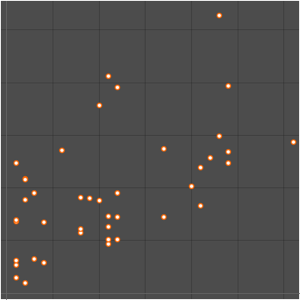
GeoListPlot[hsChicago[All, #Coordinates &]]Out[4]=
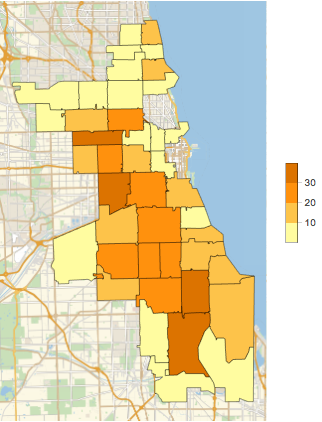
Group Head Start locations and plot their distribution by ZIP code.
In[5]:=
chicagoCounts = Length /@ GroupBy[hsChicago, #CenterZipCodeEntity &];In[6]:=
GeoRegionValuePlot[chicagoCounts]Out[6]=
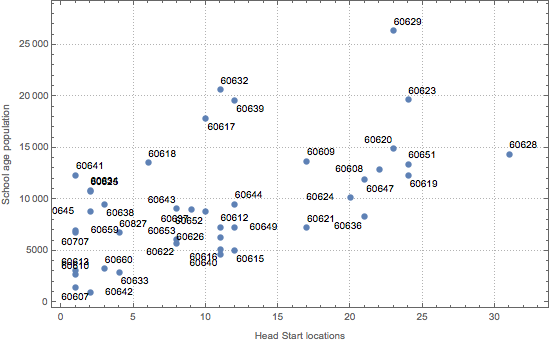
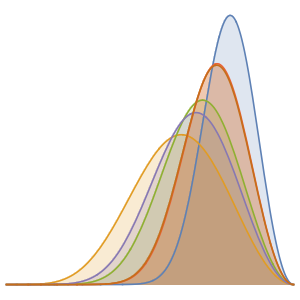
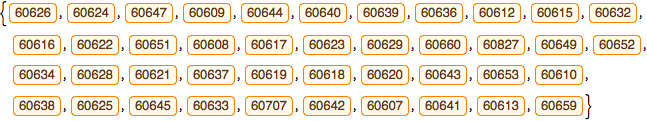
Retrieve built-in data about the school-age population in Chicago ZIP codes and plot those values against counts of Head Start locations derived from the external HUD data.
In[7]:=
zipcodes = Normal@Keys[chicagoCounts]Out[7]=
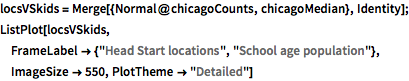
In[8]:=

chicagoMedian =
  EntityValue[zipcodes,
   EntityProperty["ZIPCode", "Population", {"Age" -> "SchoolAge"}],
   "EntityAssociation"];
show complete Wolfram Language input
Out[9]=