时间线图的布局和标签的放置
创建浪漫主义时期名人生卒日期的时间线.
In[1]:=
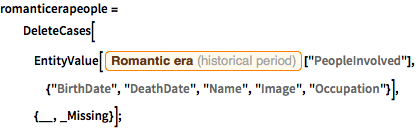
romanticerapeople =
  DeleteCases[
   EntityValue[
    Entity["HistoricalPeriod", "RomanticEra"][
     "PeopleInvolved"], {"BirthDate", "DeathDate", "Name", "Image",
     "Occupation"}], {__, _Missing}];
In[2]:=
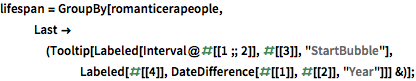
lifespan =
  GroupBy[romanticerapeople,
   Last -> (Tooltip[
       Labeled[Interval@#[[1 ;; 2]], #[[3]], "StartBubble"],
       Labeled[#[[4]], DateDifference[#[[1]], #[[2]], "Year"]]] &)];
用单独行来显示每位作曲家.
In[3]:=
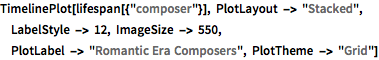
TimelinePlot[lifespan[{"composer"}], PlotLayout -> "Stacked",
 LabelStyle -> 12, ImageSize -> 550,
 PlotLabel -> "Romantic Era Composers", PlotTheme -> "Grid"]
Out[3]=
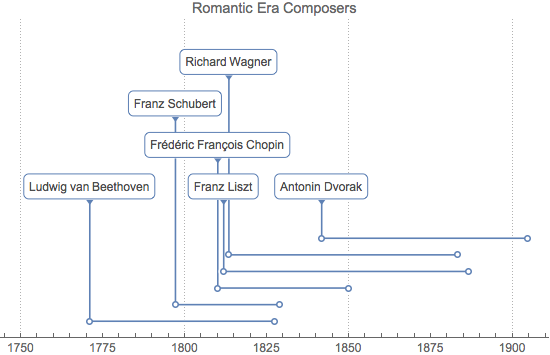
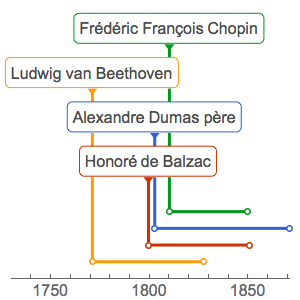
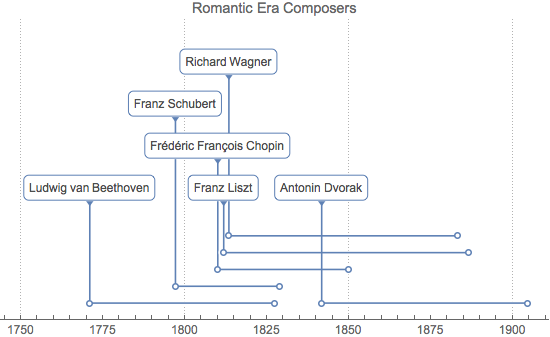
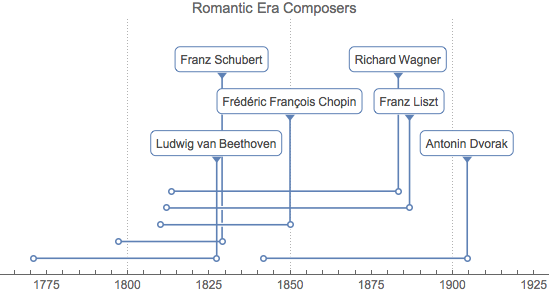
用最少行显示.
In[4]:=
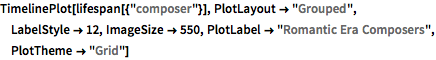
TimelinePlot[lifespan[{"composer"}], PlotLayout -> "Grouped",
 LabelStyle -> 12, ImageSize -> 550,
 PlotLabel -> "Romantic Era Composers", PlotTheme -> "Grid"]
Out[4]=
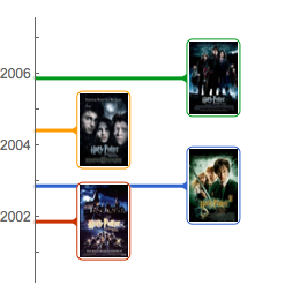
把标签放在时间段的末端.
In[5]:=

lifespan =
  GroupBy[romanticerapeople,
   Last -> (Tooltip[
       Labeled[Interval@#[[1 ;; 2]], #[[3]], "EndBubble"],
       Labeled[#[[4]], DateDifference[#[[1]], #[[2]], "Year"]]] &)];
In[6]:=
TimelinePlot[lifespan[{"composer"}], LabelStyle -> 12,
 ImageSize -> 550, PlotLabel -> "Romantic Era Composers",
 PlotTheme -> "Grid"]
Out[6]=
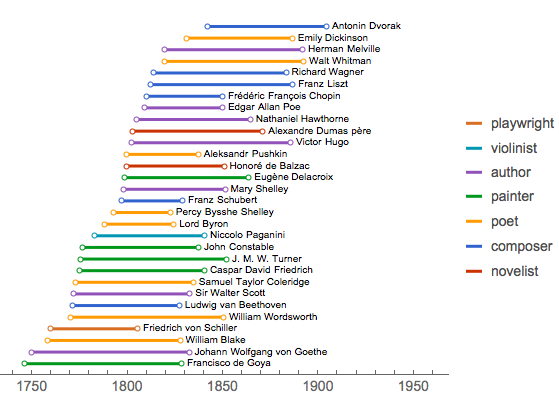
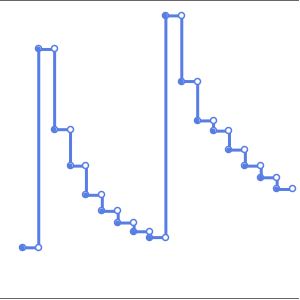
如果数据条目太多,空间又有限,可将标签置于时间段的后面.
In[7]:=
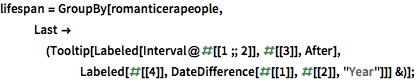
lifespan =
  GroupBy[romanticerapeople,
   Last -> (Tooltip[Labeled[Interval@#[[1 ;; 2]], #[[3]], After],
       Labeled[#[[4]], DateDifference[#[[1]], #[[2]], "Year"]]] &)];
In[8]:=
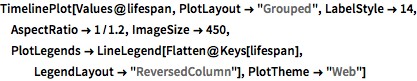
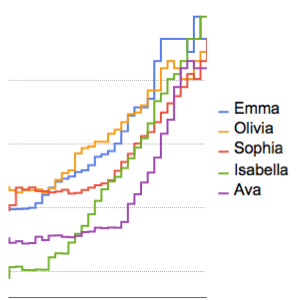
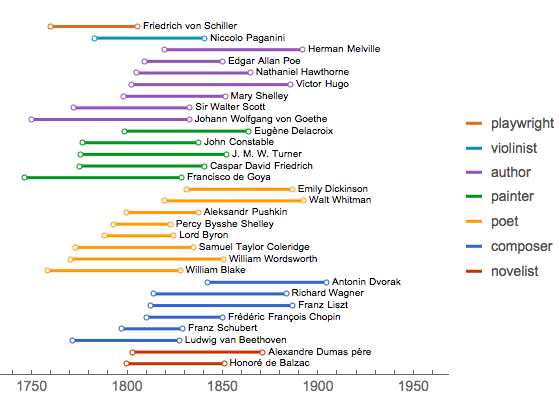
TimelinePlot[Values@lifespan, PlotLayout -> "Grouped",
 LabelStyle -> 14, AspectRatio -> 1/1.2, ImageSize -> 450,
 PlotLegends ->
  LineLegend[Flatten@Keys[lifespan],
   LegendLayout -> "ReversedColumn"], PlotTheme -> "Web"]
Out[8]=
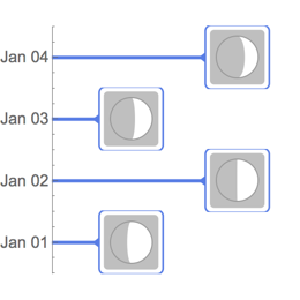
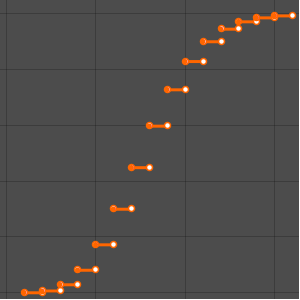
采用紧凑的布局.
In[9]:=
TimelinePlot[Values@lifespan, PlotLayout -> "Packed",
 LabelStyle -> 14, AspectRatio -> 1/1.2, ImageSize -> 450,
 PlotLegends ->
  LineLegend[Flatten@Keys[lifespan],
   LegendLayout -> "ReversedColumn"], PlotTheme -> "Web"]
Out[9]=