Timeline Layout and Label Placements
Create timelines for famous people from the Romantic period.
In[1]:=
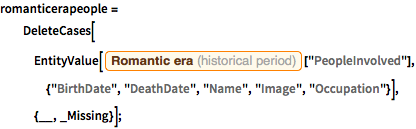
romanticerapeople =
  DeleteCases[
   EntityValue[
    Entity["HistoricalPeriod", "RomanticEra"][
     "PeopleInvolved"], {"BirthDate", "DeathDate", "Name", "Image",
     "Occupation"}], {__, _Missing}];
In[2]:=
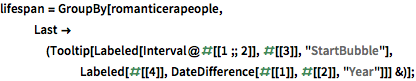
lifespan =
  GroupBy[romanticerapeople,
   Last -> (Tooltip[
       Labeled[Interval@#[[1 ;; 2]], #[[3]], "StartBubble"],
       Labeled[#[[4]], DateDifference[#[[1]], #[[2]], "Year"]]] &)];
Display each composer in his own row.
In[3]:=
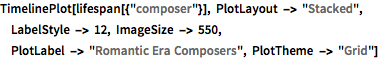
TimelinePlot[lifespan[{"composer"}], PlotLayout -> "Stacked",
 LabelStyle -> 12, ImageSize -> 550,
 PlotLabel -> "Romantic Era Composers", PlotTheme -> "Grid"]
Out[3]=
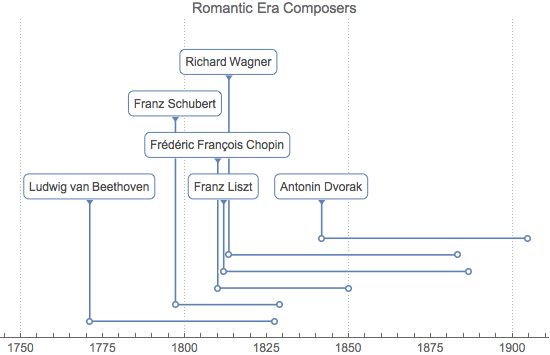
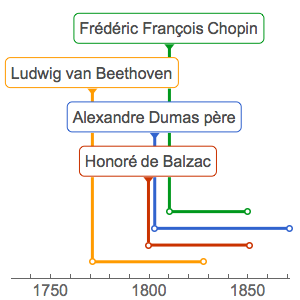
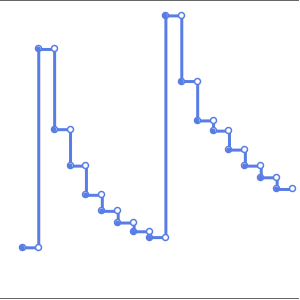
Use the minimum number of rows.
In[4]:=
TimelinePlot[lifespan[{"composer"}], PlotLayout -> "Grouped",
 LabelStyle -> 12, ImageSize -> 550,
 PlotLabel -> "Romantic Era Composers", PlotTheme -> "Grid"]
Out[4]=
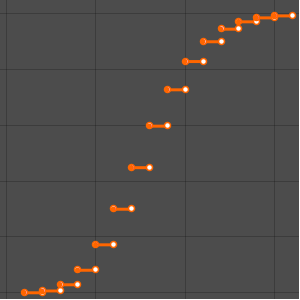
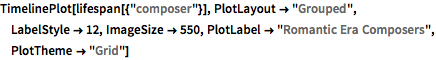
Place the label at the end of the time interval.
In[5]:=

lifespan =
  GroupBy[romanticerapeople,
   Last -> (Tooltip[
       Labeled[Interval@#[[1 ;; 2]], #[[3]], "EndBubble"],
       Labeled[#[[4]], DateDifference[#[[1]], #[[2]], "Year"]]] &)];
In[6]:=
TimelinePlot[lifespan[{"composer"}], LabelStyle -> 12,
 ImageSize -> 550, PlotLabel -> "Romantic Era Composers",
 PlotTheme -> "Grid"]
Out[6]=
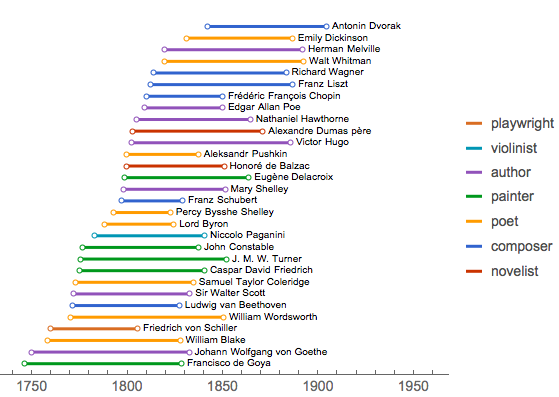
When there are many data entries and limited space, place the labels after the intervals.
In[7]:=
lifespan =
  GroupBy[romanticerapeople,
   Last -> (Tooltip[Labeled[Interval@#[[1 ;; 2]], #[[3]], After],
       Labeled[#[[4]], DateDifference[#[[1]], #[[2]], "Year"]]] &)];
In[8]:=
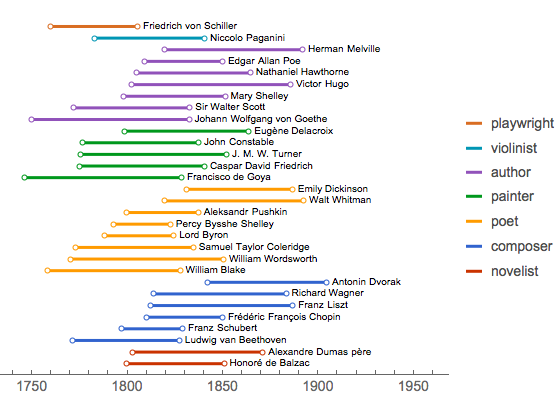
TimelinePlot[Values@lifespan, PlotLayout -> "Grouped",
 LabelStyle -> 14, AspectRatio -> 1/1.2, ImageSize -> 450,
 PlotLegends ->
  LineLegend[Flatten@Keys[lifespan],
   LegendLayout -> "ReversedColumn"], PlotTheme -> "Web"]
Out[8]=
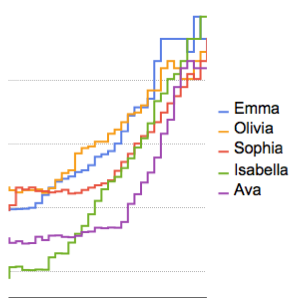
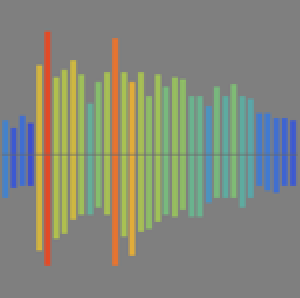
Use a packed layout across the datasets.
In[9]:=
TimelinePlot[Values@lifespan, PlotLayout -> "Packed",
 LabelStyle -> 14, AspectRatio -> 1/1.2, ImageSize -> 450,
 PlotLegends ->
  LineLegend[Flatten@Keys[lifespan],
   LegendLayout -> "ReversedColumn"], PlotTheme -> "Web"]
Out[9]=