数量値の時系列を使う
指定の場所における気温の変化を解析する.
In[1]:=
data = WeatherData[
   Entity["City", {"Champaign", "Illinois", "UnitedStates"}],
   "Temperature", {{2016, 3, 20}, {2016, 3, 22}}];
In[2]:=
temps = TimeSeries[data, MissingDataMethod -> "Interpolation"]Out[2]=
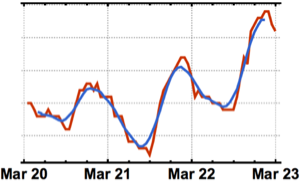
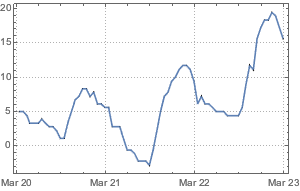
気温の時系列を可視化する.
In[3]:=
DateListPlot[temps, PlotTheme -> "Detailed"]Out[3]=
基本の特性.
In[4]:=
stats = {Min, Max, Mean, Median, StandardDeviation};
TableForm[{Map[#[temps] &, stats]}, TableHeadings -> {None, stats}]
Out[4]//TableForm=
気温を華氏に変換する.
In[5]:=
tempsF = UnitConvert[temps, "DegreesFahrenheit"];
TableForm[{Map[#[tempsF] &, stats]}, TableHeadings -> {None, stats}]
Out[5]//TableForm=
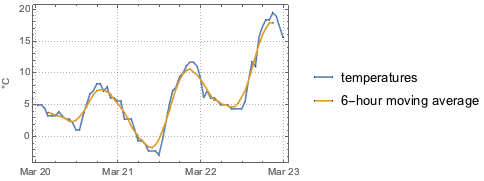
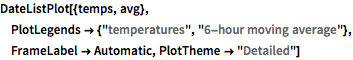
6時間の移動平均を求める.
In[6]:=
avg = MovingMap[Mean, temps, {Quantity[6, "Hours"], Center}]Out[6]=
完全なWolfram言語入力を表示する
Out[7]=