Working with Quantity-Valued Time Series
Analyze temperature variability at a given location.
In[1]:=
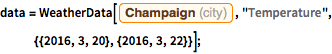
data = WeatherData[
   Entity["City", {"Champaign", "Illinois", "UnitedStates"}],
   "Temperature", {{2016, 3, 20}, {2016, 3, 22}}];
In[2]:=
temps = TimeSeries[data, MissingDataMethod -> "Interpolation"]Out[2]=
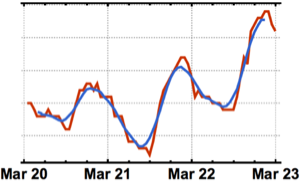
Visualize the temperature time series.
In[3]:=
DateListPlot[temps, PlotTheme -> "Detailed"]Out[3]=

Basic properties.
In[4]:=
stats = {Min, Max, Mean, Median, StandardDeviation};
TableForm[{Map[#[temps] &, stats]}, TableHeadings -> {None, stats}]
Out[4]//TableForm=
Convert temperatures to degrees Fahrenheit.
In[5]:=
tempsF = UnitConvert[temps, "DegreesFahrenheit"];
TableForm[{Map[#[tempsF] &, stats]}, TableHeadings -> {None, stats}]
Out[5]//TableForm=
Find the 6-hour moving average.
In[6]:=
avg = MovingMap[Mean, temps, {Quantity[6, "Hours"], Center}]Out[6]=
show complete Wolfram Language input

Out[7]=