全米科学財団の助成金
全米科学財団(NSF)は,2015年にほぼ12,000件の助成金を与えた.ここでは,www.nsf.gov/awardsearch/download.jspからのデータに基づいて,助成金,調査員,関係機関について調べる.特に,このデータを含む実体ストアをResourceObjectとしてロードして,助成金のサイズの分布,提案書と助成金の定量的特性と定性的特性,関連機関の地理的散らばりについて調べる.
まず,NSFデータを含む助成金の実体ストアをResourceObjectからロードする.
In[1]:=
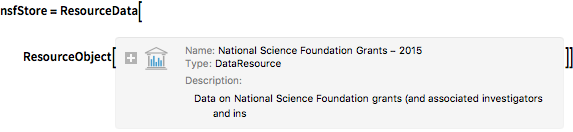
nsfStore = ResourceData[

ResourceObject[
Association[
   "Name" -> "National Science Foundation Grants - 2015",
    "UUID" -> "0e9655df-86b6-4e20-bcc9-87365562357b",
    "ResourceType" -> "DataResource", "Version" -> "1.0.0",
    "Description" -> "Data on National Science Foundation grants (and \
associated investigators and institutions) awarded in the the year \
2015.", "ContentSize" -> Quantity[0, "Bytes"],
    "ContentElements" -> {"EntityStore"}]]]
Out[1]=
このセッションのためにストアを登録する.
In[2]:=
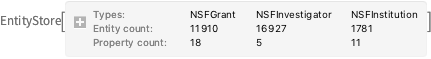
PrependTo[$EntityStores, nsfStore];ストアからの"NSFGrant"実体タイプを使って使用可能な助成金特性を見る.
In[3]:=
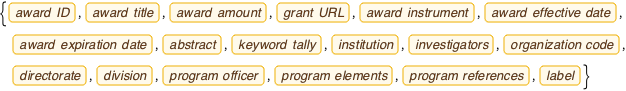
EntityValue["NSFGrant", "Properties"]Out[3]=
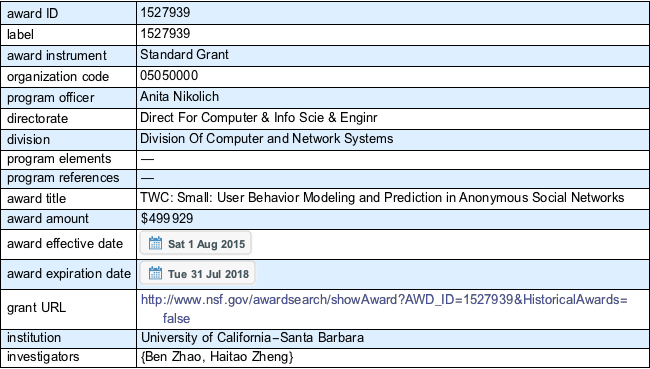
ランダムに選択した助成金についてのデータを返す.
完全なWolfram言語入力を表示する
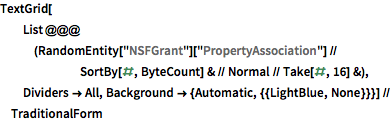
Out[4]//TraditionalForm=
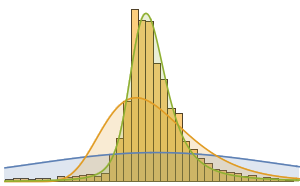
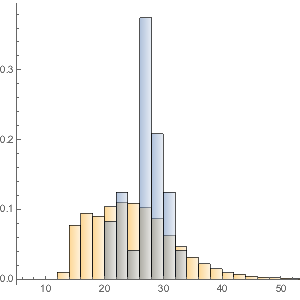
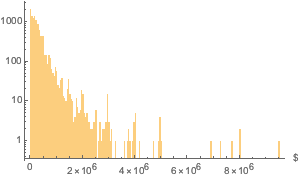
助成金の額の分布をプロットする.
In[5]:=
awardAmounts = EntityValue["NSFGrant", "AwardAmount"];In[6]:=
Histogram[awardAmounts, ScalingFunctions -> {Identity, "Log"},
 PlotRange -> All, AxesLabel -> Automatic]
Out[6]=
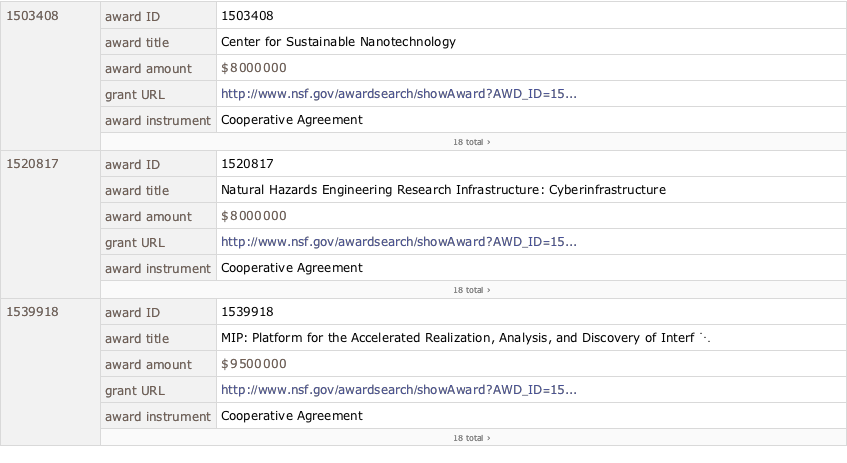
最も高額の3つの助成金の詳細を表示する.
In[7]:=
EntityValue[
 EntityClass["NSFGrant", "AwardAmount" -> TakeLargest[3]], "Dataset"]
Out[7]=
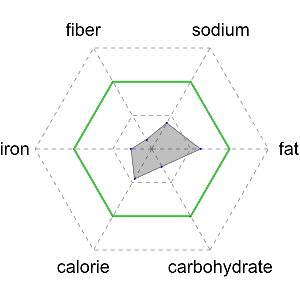
NSFの分野ごとの助成金総額を調べる.
完全なWolfram言語入力を表示する
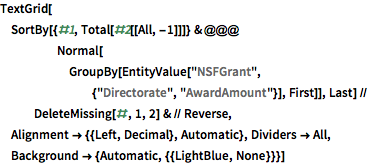
Out[8]=
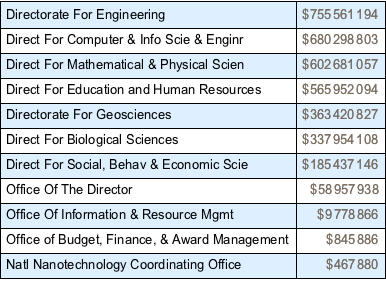
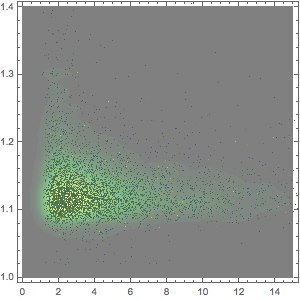
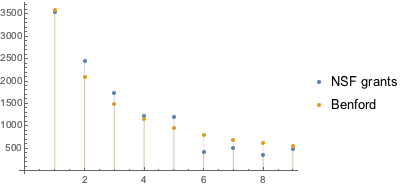
助成金額(米ドル)の1桁目の数字をベンフォード(Benford)の法則で比較する.
完全なWolfram言語入力を表示する
Out[9]=
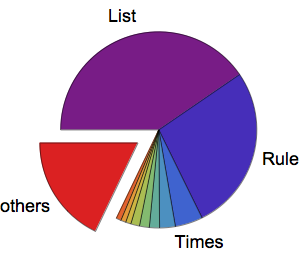
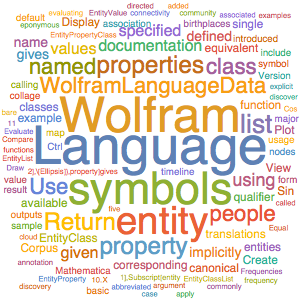
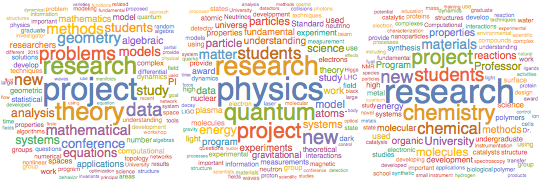
数学,物理学,化学の助成金で最も多く使われた単語のワードクラウドを作る.
In[10]:=
keywords =
  EntityValue[EntityClass["NSFGrant", "Division" -> #],
     "KeywordTally"] & /@ {"Division Of Mathematical Sciences",
    "Division Of Physics", "Division Of Chemistry"};
In[11]:=
Row[WordCloud[
    Merge[Association @@ (Rule @@@ #) & /@ DeleteMissing[#],
     Total]] & /@ keywords]
Out[11]=
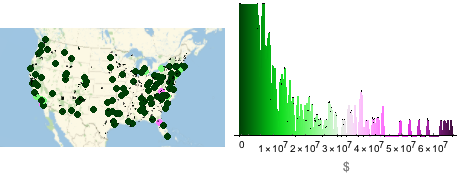
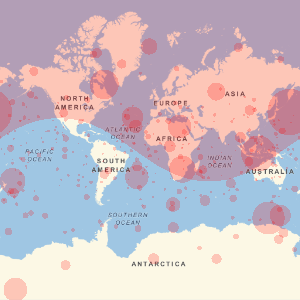
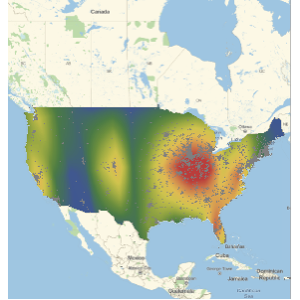
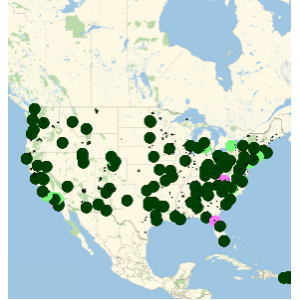
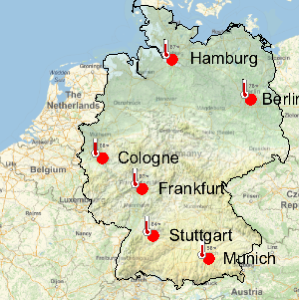
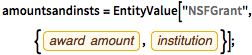
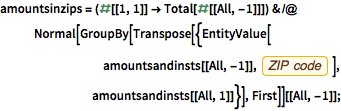
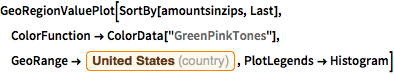
ZIPコードと金額によって全米科学財団の助成金を可視化する.
完全なWolfram言語入力を表示する
Out[14]=