Federal Deposit Insurance Corporation Institutional Data
The Federal Deposit Insurance Corporation (FDIC) is an independent US government agency charged with insuring deposits in US financial institutions. Presently, deposits in member institutions are insured up to $250,000. Here, the holdings, size distribution, and geographic dispersal of member institutions are explored.
First, load an entity store of FDIC data as a ResourceObject.
fdic = ResourceData[

ResourceObject[
Association[
   "Name" -> "FDIC Institution EntityStore",
    "UUID" -> "6f5d37d4-1406-483c-b67c-f58d903d16b1",
    "ResourceType" -> "DataResource", "Version" -> "1.0.0",
    "Description" -> "A Wolfram Language EntityStore with selected \
data on FDIC insured institutions",
    "ContentSize" -> Quantity[0, "Bytes"],
    "ContentElements" -> {"EntityStore"}]]]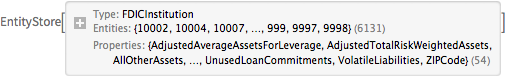
Register the store for this session.
PrependTo[$EntityStores, fdic];Count the number of FDIC institutions.
Length[ents = EntityList["FDICInstitution"]]List some of the available properties of the entity store.
EntityProperties["FDICInstitution"] // Sort // Take[#, 20] &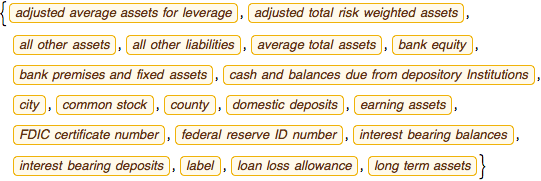
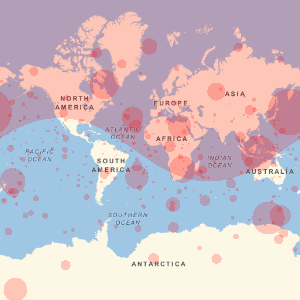
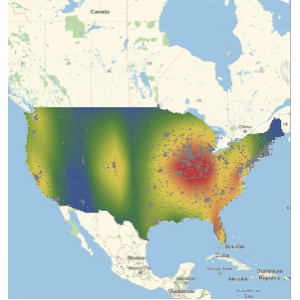
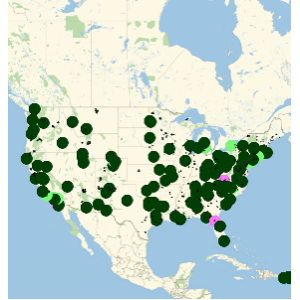
Visualize the geographic locations of FDIC-affiliated banks.
GeoListPlot[EntityList["FDICInstitution"], PlotMarkers -> "$"]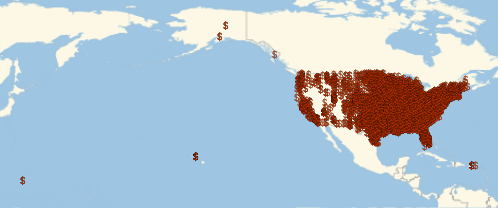
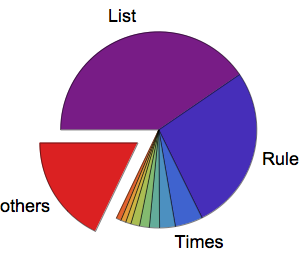
Display the rank distribution in a log-log plot.
ListLogLogPlot[
 Reverse@Sort[EntityValue["FDICInstitution", "TotalAssets"]],
 AxesLabel -> Automatic, PlotStyle -> PointSize[Medium]]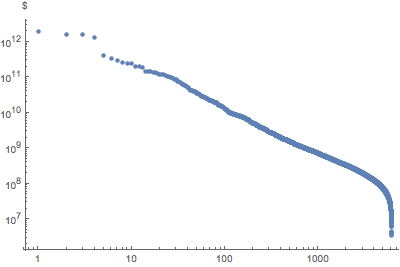
Plot employees vs. assets.
empVsAssets =
  EntityValue[
"FDICInstitution", {"TotalEmployeeNumber", "TotalAssets"}];ListLogLogPlot[empVsAssets, AxesLabel -> Automatic]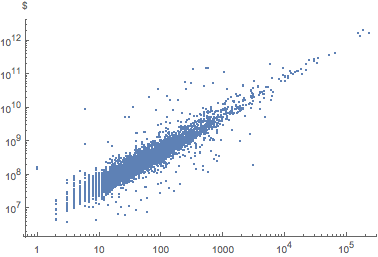
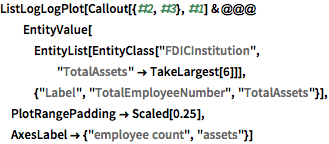
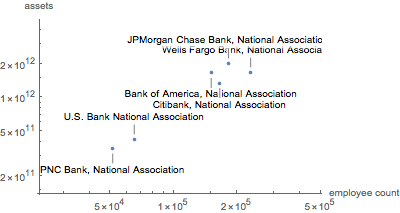
Label the six largest institutions.
Plot liabilities vs. assets.
assetsVsLiability =
EntityValue["FDICInstitution", {"TotalAssets", "TotalLiabilities"}];ListLogLogPlot[assetsVsLiability, AxesLabel -> Automatic]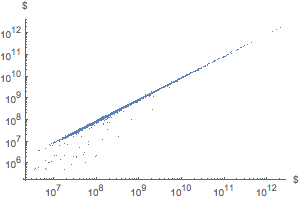
Plot net loans and leases vs. total deposits together with a fit.
loanVsDeposit =
  EntityValue[
"FDICInstitution", {"NetLoansAndLeases", "TotalDeposits"}];nmf = NonlinearModelFit[
Select[QuantityMagnitude /@ loanVsDeposit, Min[#] > 0 &],
c + a x^\[Alpha], {a, \[Alpha], c}, x]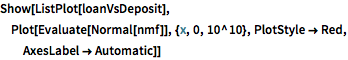
Show[ListPlot[loanVsDeposit],
 Plot[Evaluate[Normal[nmf]], {x, 0, 10^10}, PlotStyle -> Red,
  AxesLabel -> Automatic]]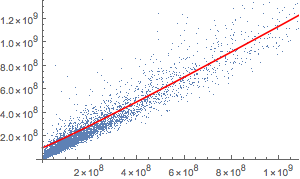
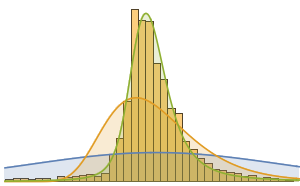
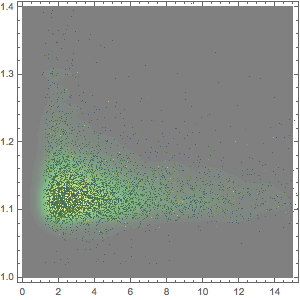
Compare Tier 1 (secure) and Tier 2 capital (riskier) to total assets.
{tierOneCapitalToAssets,
   tierTwoCapitalToAssetsCapitalToAssets} = (Divide @@@
      EntityValue[
       "FDICInstitution", {#, "TotalAssets"}]) & /@ {"TierOneCapital",
     "TierTwoRiskBasedCapital"};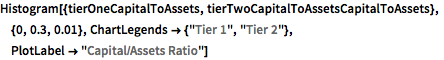
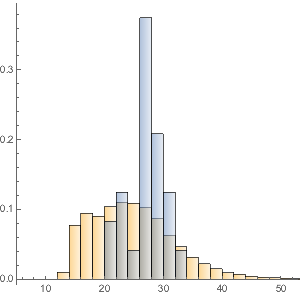
Histogram[{tierOneCapitalToAssets,
  tierTwoCapitalToAssetsCapitalToAssets}, {0, 0.3, 0.01},
 ChartLegends -> {"Tier 1", "Tier 2"},
 PlotLabel -> "Capital/Assets Ratio"]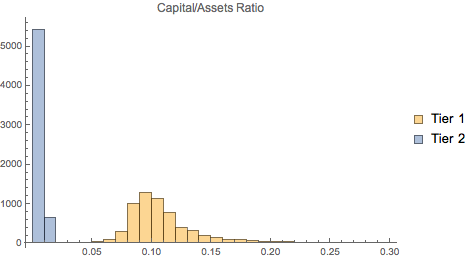
Retrieve the distribution of assets as an "EntityAssociation".
dat = EntityValue["FDICInstitution", "TotalAssets",
   "EntityAssociation"];
Plot the distribution of assets.
Histogram[dat, "Log", AxesLabel -> Automatic]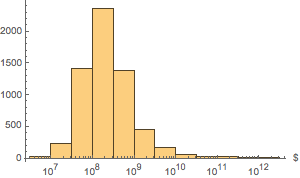
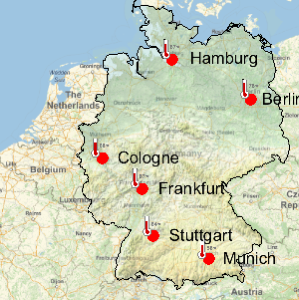
Display locations of banks with assets more than 5 billion and 300 billion dollars.
GeoListPlot[
   Keys[Select[dat,
     GreaterThan[Quantity[#, "USDollars"]]]]] & /@ {5*^9, 300*^9}
Graphically discover that the top 10 banks hold more assets than the remaining 6121 combined.
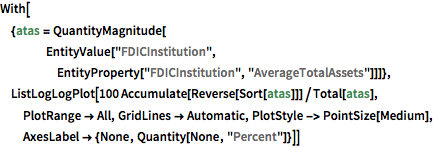
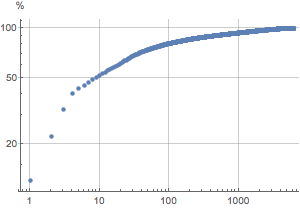
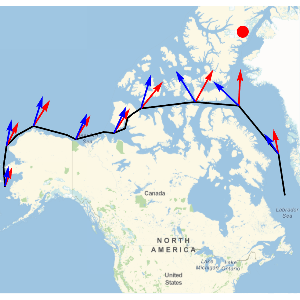
Find banks with the highest 1% of deposits.
dat1 = EntityValue["FDICInstitution", "TotalDeposits",
"EntityAssociation"];{bottom1percent, top1percent} =
Quantile[values = Values[dat1], {0.01, 0.99}]Plot them on a map.
GeoListPlot[Keys[Select[dat1, GreaterThan[top1percent]]]]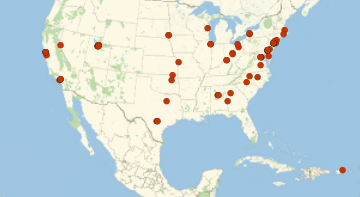
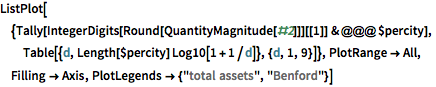
The distribution of the assets per city fulfills Benford's law to a remarkable degree.
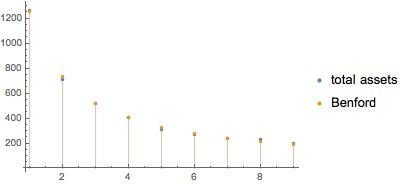
Show banks with the greatest financial leverage.
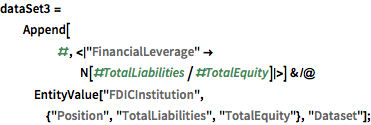
dataSet3[TakeLargestBy["FinancialLeverage", 10]]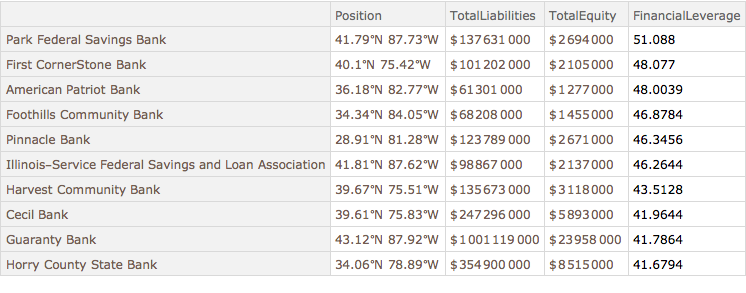
Plot the distribution of the financial leverages.
Histogram[dataSet3[All, "FinancialLeverage"], {0, 20, 0.5},
 PlotLabel -> "FDIC banks Financial Leverage distribution"]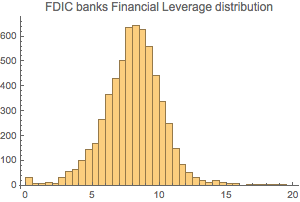
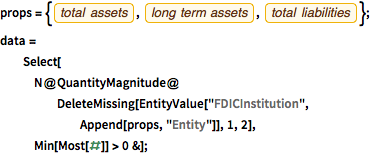
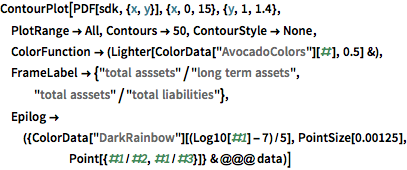
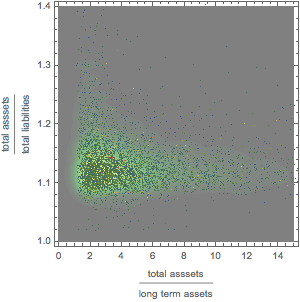
Graphically explore the relationship among assets, long-term assets, and liabilities.