수량 배열
QuantityArray는 Quantity 개체 배열의 효율적인 저장 및 조작을 가능하게하므로 물리적 단위를 가지는 데이터 분석에 매우 이상적입니다. 시스템 전반에 걸친 수량의 통합을 유지하기위해, 몇몇의 함수는 QuantityArray 개체를 이해하고 반환합니다.
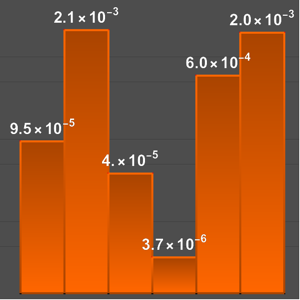
QuantityDistribution 개체에서 샘플을 가져옵니다.
In[1]:=
RandomVariate[ParetoDistribution[Quantity[500., "USDollars"], 4], 300]Out[1]=
QuantityArray 개체는 Quantity 요소의 정규 배열과 동일합니다.
In[2]:=
RandomVariate[ParetoDistribution[Quantity[500., "USDollars"], 4], 300];
Normal[Take[%, 10]]
Out[2]=
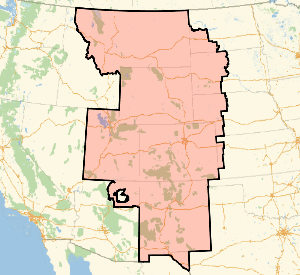
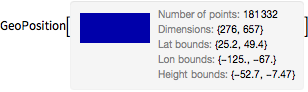
고도 데이터 및 자기장 데이터 같은 지리 데이터를 계산 또는 다운로드합니다.
In[3]:=
GeoElevationData[Entity["Country", "UnitedStates"]]Out[3]=
In[4]:=
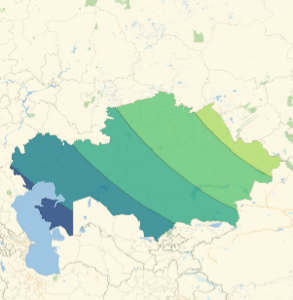
GeomagneticModelData[
 Entity["GeographicRegion", "Antarctica"], "Magnitude"]
Out[4]=
경위도 각의 배열을 조작합니다.
In[5]:=
GeoElevationData[
 Entity["Country", "UnitedStates"], "Undulation", GeoPosition]
Out[5]=
In[6]:=
GeoElevationData[
 Entity["Country", "UnitedStates"], "Undulation", GeoPosition];
LatitudeLongitude[%]
Out[6]=
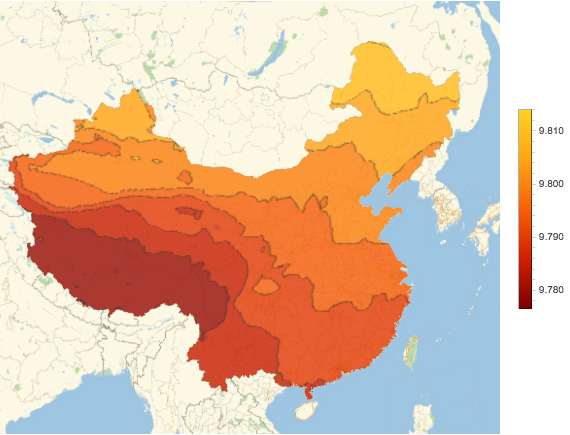
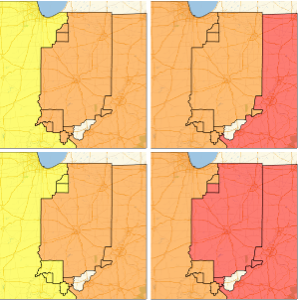
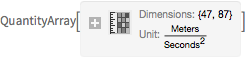
중국의 중력장에 대한 수직 성분의 데이터 배열을 취득합니다.
In[7]:=
data = GeogravityModelData[Entity["Country", "China"],
  "DownComponent"]
Out[7]=
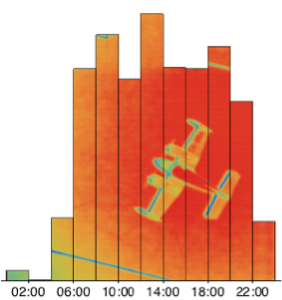
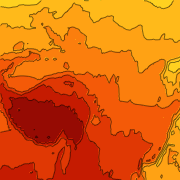
이 지역의 지구 중력장이 표준 값인 9.81  과 어떻게 다른지 조사합니다.
In[8]:=
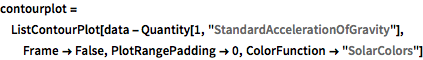
contourplot =
 ListContourPlot[data - Quantity[1, "StandardAccelerationOfGravity"],
  Frame -> False, PlotRangePadding -> 0,
  ColorFunction -> "SolarColors"]
Out[8]=
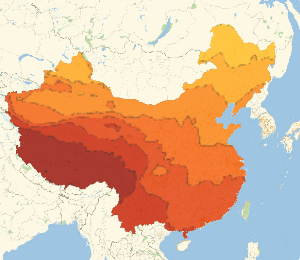
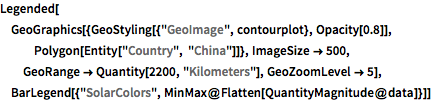
중국 지도에 등고선 플롯을 오버레이합니다.
전체 Wolfram 언어 입력 표시하기
Out[9]=