‹›단위 및 날짜시간대 비교
그리니치 평균시에서 중부 표준시 현재의 수치 오프셋을 얻습니다.
TimeZoneOffset[Entity["TimeZone", "America/Chicago"]]특정 날짜의 다른 시간대와 관계되는 오프셋을 얻습니다.
TimeZoneOffset[Entity["TimeZone", "America/Chicago"],
Entity["TimeZone", "Europe/London"], DateObject[{2015, 3, 7}]]시간대 영역의 지리적 표현을 얻습니다.
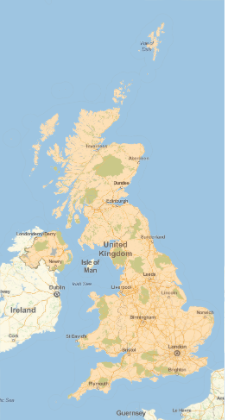
GeoGraphics[{Orange, Polygon[Entity["TimeZone", "Europe/London"]]}]인디애나의 다양한 지역에서 두 날짜 사이의 오프셋 차이를 비교합니다.
전체 Wolfram 언어 입력 표시하기
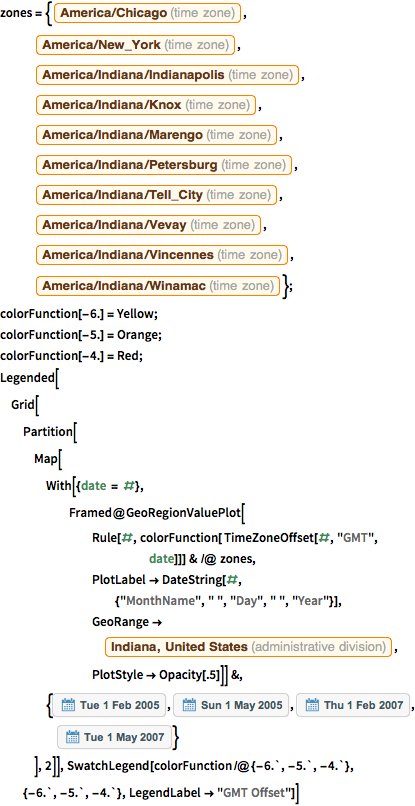
zones = {Entity["TimeZone", "America/Chicago"],
   Entity["TimeZone", "America/New_York"],
   Entity["TimeZone", "America/Indiana/Indianapolis"],
   Entity["TimeZone", "America/Indiana/Knox"],
   Entity["TimeZone", "America/Indiana/Marengo"],
   Entity["TimeZone", "America/Indiana/Petersburg"],
   Entity["TimeZone", "America/Indiana/Tell_City"],
   Entity["TimeZone", "America/Indiana/Vevay"],
   Entity["TimeZone", "America/Indiana/Vincennes"],
   Entity["TimeZone", "America/Indiana/Winamac"]};
colorFunction[-6.] = Yellow;
colorFunction[-5.] = Orange;
colorFunction[-4.] = Red;
Legended[Grid[
  Partition[
   Map[With[{date = #},
      Framed@GeoRegionValuePlot[
        Rule[#, colorFunction[ TimeZoneOffset[#, "GMT", date]]] & /@
         zones, PlotLabel ->
         DateString[#, {"MonthName", " ", "Day", " ", "Year"}],
        GeoRange ->
         Entity["AdministrativeDivision", {"Indiana",
           "UnitedStates"}],
        PlotStyle -> Opacity[.5]]] &, {DateObject[{2005, 2, 1}],
     DateObject[{2005, 5, 1}], DateObject[{2007, 2, 1}],
     DateObject[{2007, 5, 1}]}
    ], 2]],
 SwatchLegend[colorFunction /@ {-6., -5., -4.}, {-6., -5., -4.},
  LegendLabel -> "GMT Offset"]]


