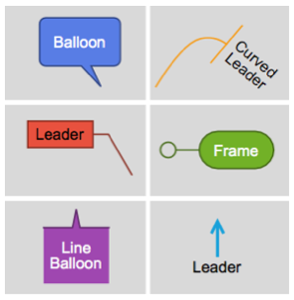
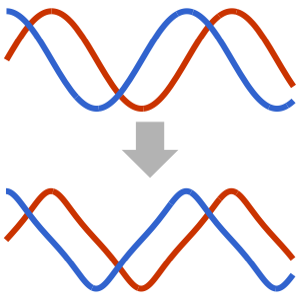
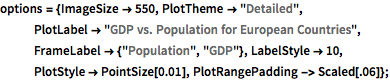
针对点的标签系统
手动用不同长度的标签标注离散点有时候会很繁琐. 新的标签系统为此提供了自动化解决方案.
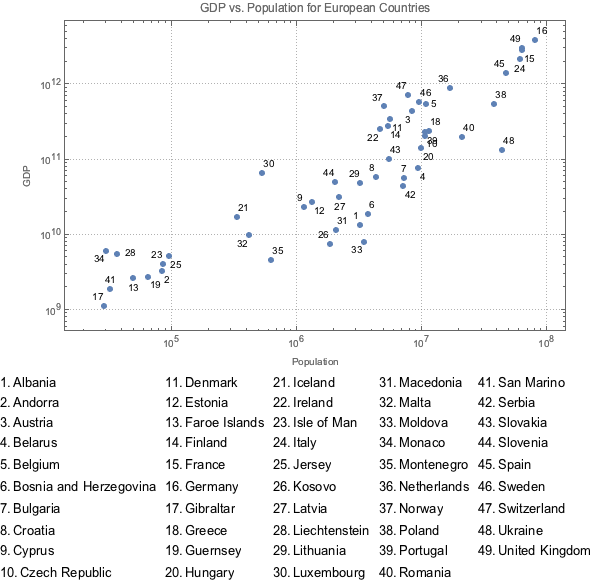
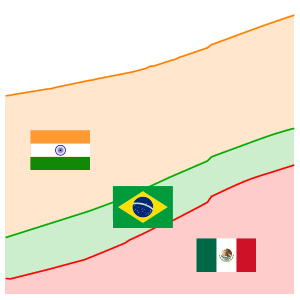
下面的例子将绘制所有欧洲城市的 GDP 与人口.
显示完整的 Wolfram 语言输入
In[2]:=
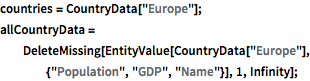
countries = CountryData["Europe"];
allCountryData =
DeleteMissing[
EntityValue[CountryData["Europe"], {"Population", "GDP", "Name"}],
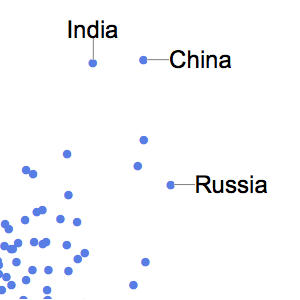
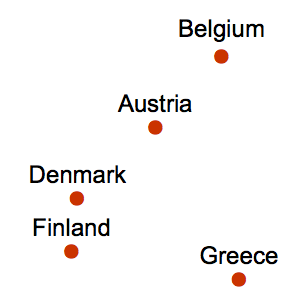
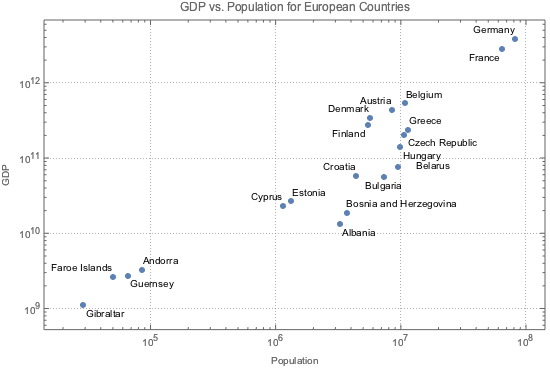
1, Infinity];在此我们展示对 20 个点进行自动标注的功能.
In[3]:=
ListLogLogPlot[
 allCountryData[[1 ;; 20, {1, 2}]] ->
  allCountryData[[1 ;; 20, 3]], options]
Out[3]=
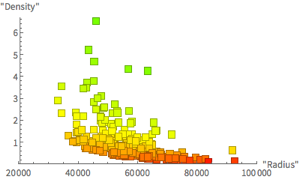
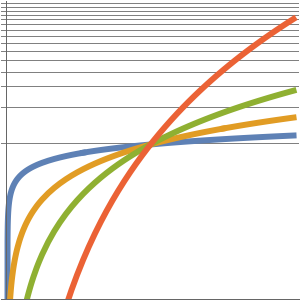
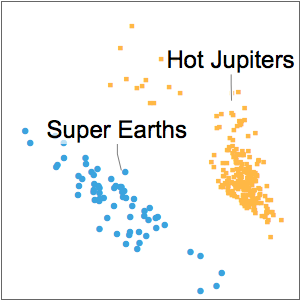
当点较多且非常集中时,将标签和图例命令结合使用效果很好.
In[4]:=
legend = Multicolumn[
   Table[Text@
     Row[{ToString[i] <> ".", allCountryData[[i]][[3]]}, " "], {i,
     Length[allCountryData]}], 5];
In[5]:=
Legended[ListLogLogPlot[allCountryData[[All, {1, 2}]],
  LabelingFunction -> (First@#2 &), options], Placed[legend, Bottom]]
Out[5]=