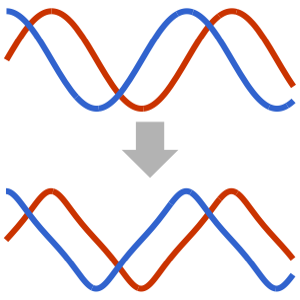
점 특징 라벨링 시스템
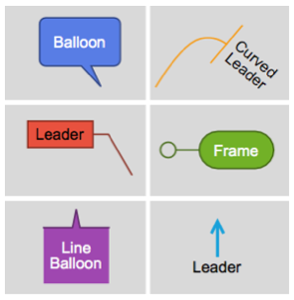
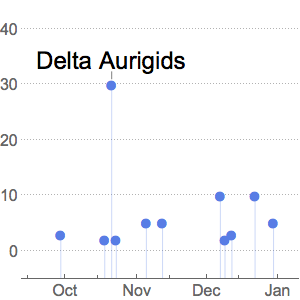
흩어져 있는 점에 수동으로 다양한 길이의 라벨을 붙이는 것은 쉽지않은 일입니다. 새로운 라벨 시스템은 자동으로 이를 수행하는 방법을 제공합니다.
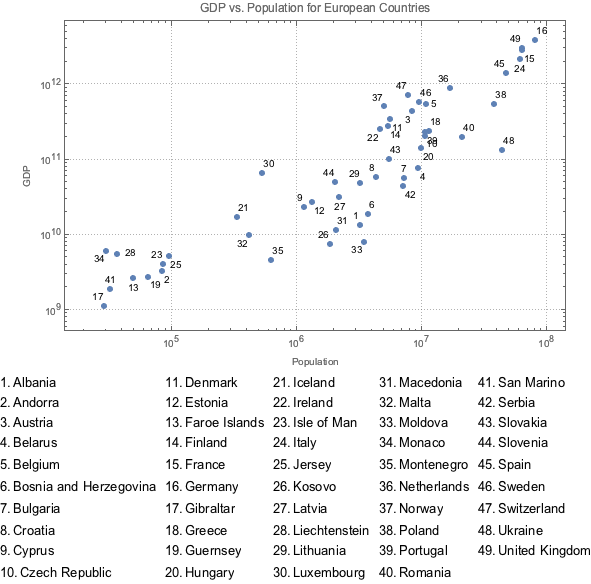
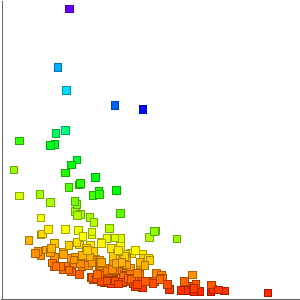
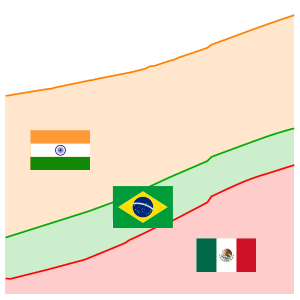
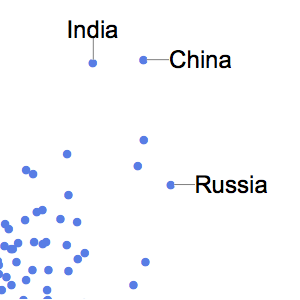
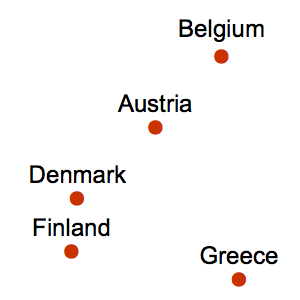
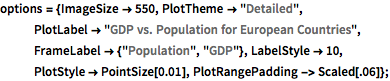
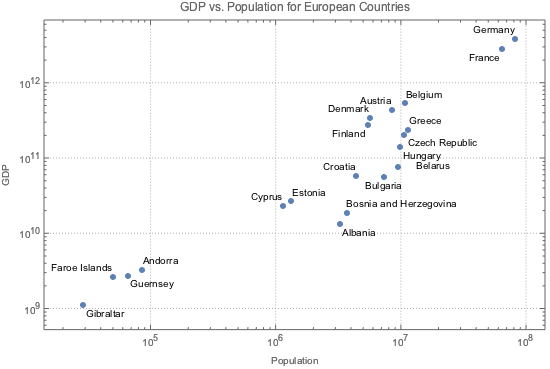
다음은 모든 유럽 국가의 GDP vs 인구의 플롯의 예입니다.
전체 Wolfram 언어 입력 표시하기
In[2]:=
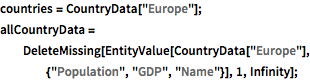
countries = CountryData["Europe"];
allCountryData =
  DeleteMissing[
   EntityValue[CountryData["Europe"], {"Population", "GDP", "Name"}],
   1, Infinity];
자동 점 특징 라벨을 사용한 20가지 예를 표시합니다.
In[3]:=
ListLogLogPlot[
 allCountryData[[1 ;; 20, {1, 2}]] ->
  allCountryData[[1 ;; 20, 3]], options]
Out[3]=
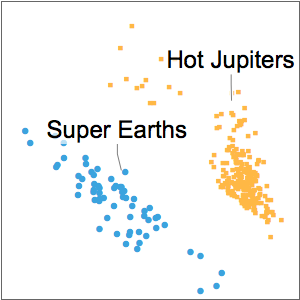
점이 너무 한곳에 밀집해 있는 경우에는 라벨과 범례를 조합하면 작업을 적절히 수행해낼 수 있습니다.
In[4]:=
legend = Multicolumn[
   Table[Text@
     Row[{ToString[i] <> ".", allCountryData[[i]][[3]]}, " "], {i,
     Length[allCountryData]}], 5];
In[5]:=
Legended[ListLogLogPlot[allCountryData[[All, {1, 2}]],
  LabelingFunction -> (First@#2 &), options], Placed[legend, Bottom]]
Out[5]=