ハリケーンデータの可視化
渦巻きの単純なモデルは核内のボディの回転と核外の減衰する角速度との組み合せで与えられる.
完全なWolfram言語入力を表示する
In[2]:=
wind[r_, z_] := If[r <= rcore, w r, (w a^2)/r];圧力を求めるための公式は,半径と高度から以下の公式を与える.
In[3]:=

pressure[r_, z_] :=
  If[r < rcore,
   1/2 rho w^2 r^2 - rho g z + Subscript[rho,
    0], -((rho w^2 rcore^4)/(2 r^2)) - rho g z + rho w^2 rcore^2 +
    Subscript[rho, 0]];
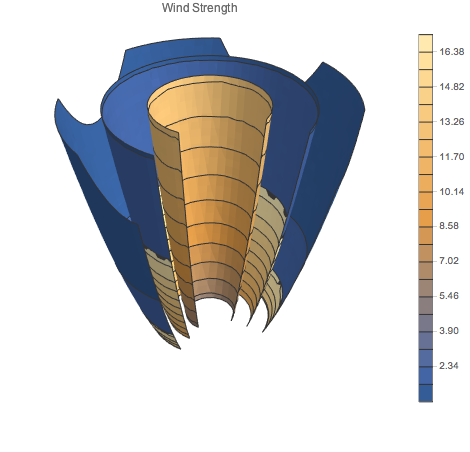
風速をプロットする.これは系の中心の外側が最も速い.
In[4]:=

SliceContourPlot3D[
 wind[Sqrt[x^2 + y^2], z], {x^2 + y^2 == 3 z, x^2 + y^2 == 6 z,
  x^2 + y^2 == 1 z}, {x, -5, 5}, {y, -5, 5}, {z, 1, 5},
 Contours -> 20,
 RegionFunction -> Function[{x, y, z}, x < 0 || y > 0],
 PlotTheme -> "NoAxes", PlotLegends -> Automatic,
 PlotLabel -> "Wind Strength", ImageSize -> 400]
Out[4]=

風向をベクトル場としてプロットする.
In[5]:=

SliceVectorPlot3D[{(wind[Sqrt[x^2 + y^2], z] y)/
  Norm[{x, y}], (-wind[Sqrt[x^2 + y^2], z] x)/Norm[{x, y}],
  0}, {x^2 + y^2 == z, x^2 + y^2 == 3 z, x^2 + y^2 == 6 z}, {x, -5,
  5}, {y, -5, 5}, {z, 1, 5}, ImageSize -> 400, PlotLegends -> None,
 VectorStyle -> "Arrow3D", VectorScale -> {Medium, 0.5, Automatic},
 VectorPoints -> 8,
 RegionFunction -> Function[{x, y, z}, x < 0 || y > 0],
 PlotTheme -> "NoAxes", PlotLabel -> "Wind Direction"]
Out[5]=

圧力を3D密度としてプロットする.系の中心の低い相対密度に注意のこと.
In[6]:=

DensityPlot3D[
 pressure[Sqrt[x^2 + y^2], z], {x, -5, 5}, {y, -5, 5}, {z, 1, 5},
 ImageSize -> 400, PlotLegends -> Automatic, PlotTheme -> "NoAxes",
 RegionFunction ->
  Function[{x, y, z}, (x^2 + y^2 <= 6 z) && (x < 0 || y > 0)],
 PlotLabel -> "Air Pressure",
 OpacityFunction -> Function[f, f/5 + 0.1]]
Out[6]=


