Hurricane-Daten visualisieren
Das einfache Modell eines Wirbels ist gegeben durch die Kombination der Körperrotation innerhalb eines Kernbereichs und einer schwindenden Winkelfrequenz außerhalb.
Den kompletten Wolfram Language-Input zeigen
In[2]:=
wind[r_, z_] := If[r <= rcore, w r, (w a^2)/r];Die Formel for finding pressure ergibt die folgende Formel, ausgedrückt durch Radius und Höhe.
In[3]:=
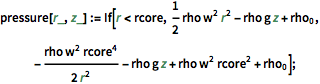
pressure[r_, z_] :=
If[r < rcore,
1/2 rho w^2 r^2 - rho g z + Subscript[rho,
0], -((rho w^2 rcore^4)/(2 r^2)) - rho g z + rho w^2 rcore^2 +
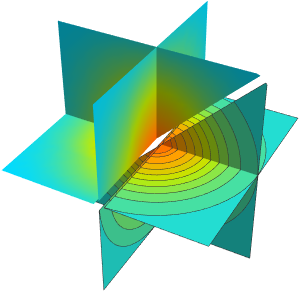
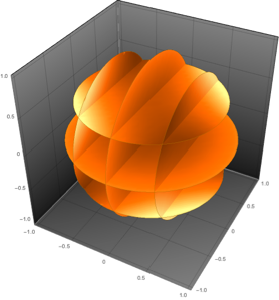
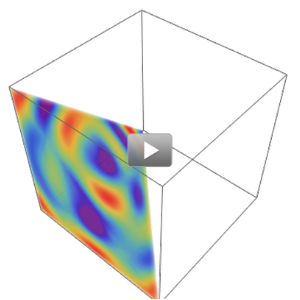
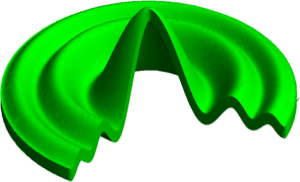
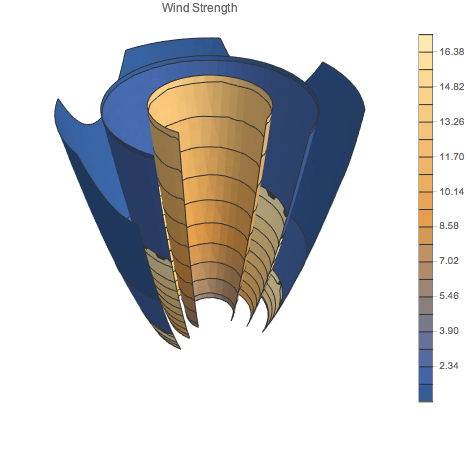
Subscript[rho, 0]];Plotten Sie die Windgeschwindigkeiten, die außerhalb des Zentrums des Systems am höchsten sind.
In[4]:=
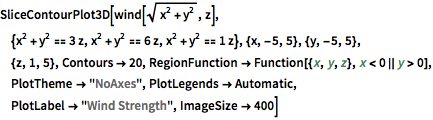
SliceContourPlot3D[
 wind[Sqrt[x^2 + y^2], z], {x^2 + y^2 == 3 z, x^2 + y^2 == 6 z,
  x^2 + y^2 == 1 z}, {x, -5, 5}, {y, -5, 5}, {z, 1, 5},
 Contours -> 20,
 RegionFunction -> Function[{x, y, z}, x < 0 || y > 0],
 PlotTheme -> "NoAxes", PlotLegends -> Automatic,
 PlotLabel -> "Wind Strength", ImageSize -> 400]
Out[4]=
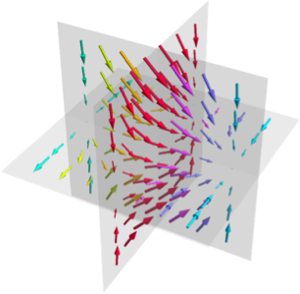
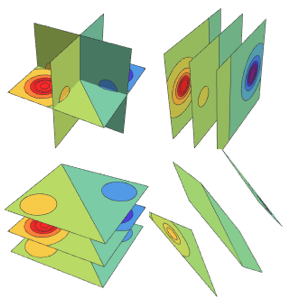
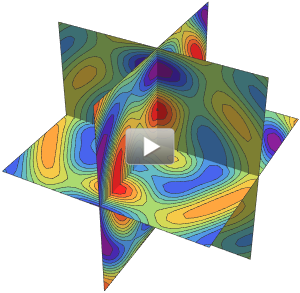
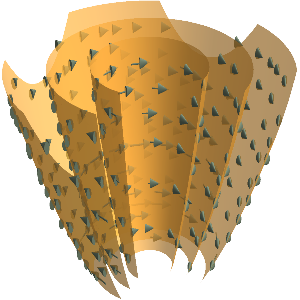
Plotten Sie die Windrichtungen als Vektorfeld.
In[5]:=
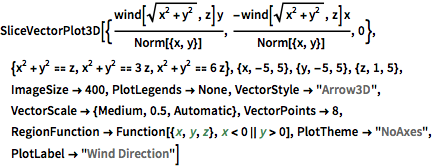
SliceVectorPlot3D[{(wind[Sqrt[x^2 + y^2], z] y)/
  Norm[{x, y}], (-wind[Sqrt[x^2 + y^2], z] x)/Norm[{x, y}],
  0}, {x^2 + y^2 == z, x^2 + y^2 == 3 z, x^2 + y^2 == 6 z}, {x, -5,
  5}, {y, -5, 5}, {z, 1, 5}, ImageSize -> 400, PlotLegends -> None,
 VectorStyle -> "Arrow3D", VectorScale -> {Medium, 0.5, Automatic},
 VectorPoints -> 8,
 RegionFunction -> Function[{x, y, z}, x < 0 || y > 0],
 PlotTheme -> "NoAxes", PlotLabel -> "Wind Direction"]
Out[5]=
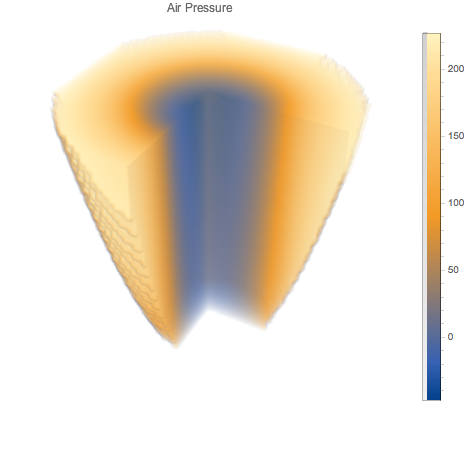
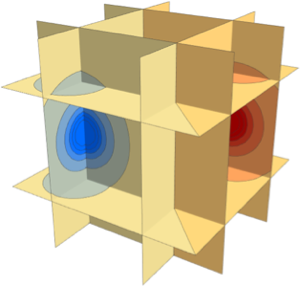
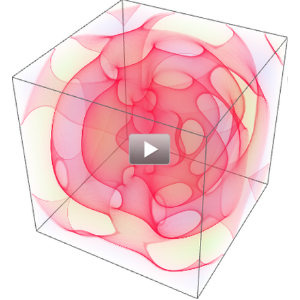
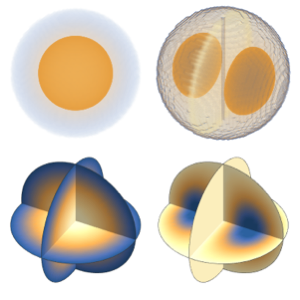
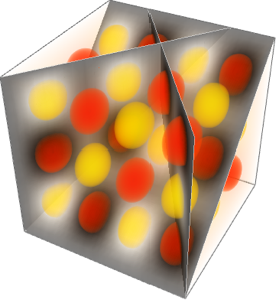
Plotten Sie den Druck als 3D-Dichte. Beachten Sie den relativ niedrigen Druck im Zentrum des Hurricane-Systems.
In[6]:=
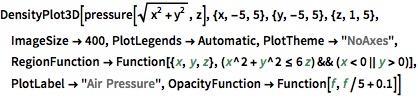
DensityPlot3D[
 pressure[Sqrt[x^2 + y^2], z], {x, -5, 5}, {y, -5, 5}, {z, 1, 5},
 ImageSize -> 400, PlotLegends -> Automatic, PlotTheme -> "NoAxes",
 RegionFunction ->
  Function[{x, y, z}, (x^2 + y^2 <= 6 z) && (x < 0 || y > 0)],
 PlotLabel -> "Air Pressure",
 OpacityFunction -> Function[f, f/5 + 0.1]]
Out[6]=