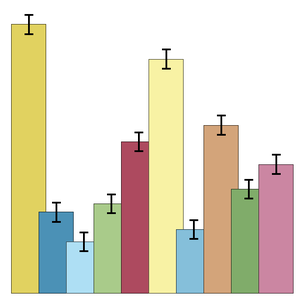
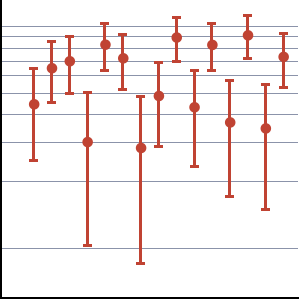
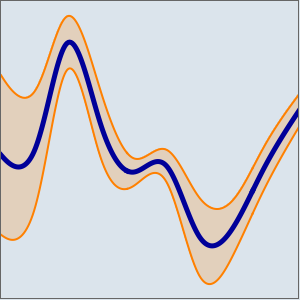
ListPlot with Uncertainty
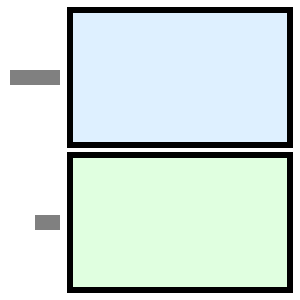
Plot uncertain values with ListPlot as intervals in the  direction.
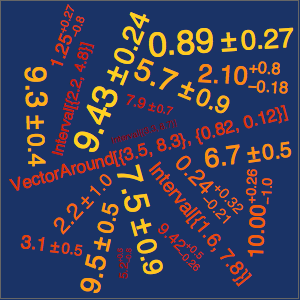
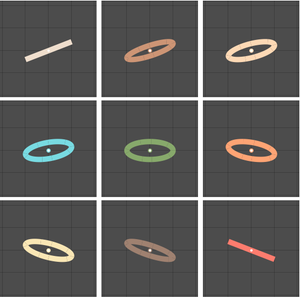
The position of intervals relative to the points shows asymmetric uncertainty values.
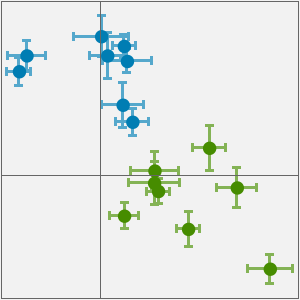
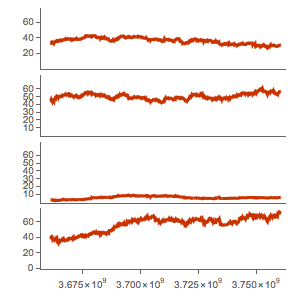
Uncertainty in the  and
and  coordinates is represented by corresponding intervals.