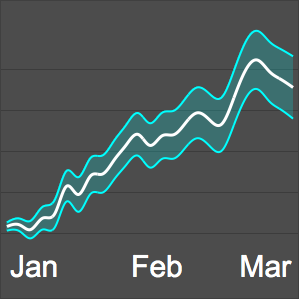
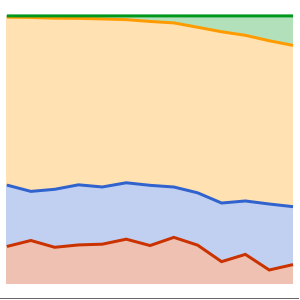
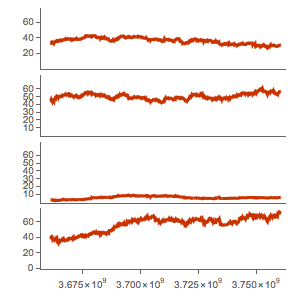
Stacked Layout
Plot the total electricity production for the US over time, broken down by source.
By using a stacked plot, you can see the individual components that make up the whole.
Use a layout that shows the cumulative percentages instead of absolute amounts, showing the emergence of wind as a growing source of power.