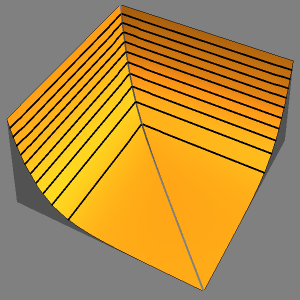
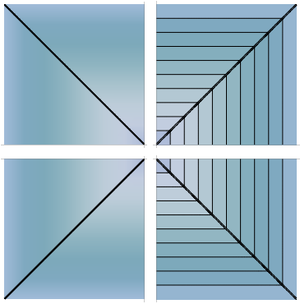
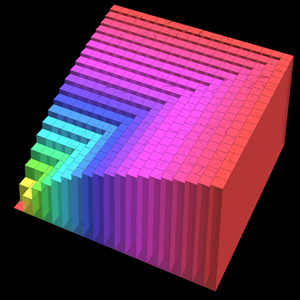
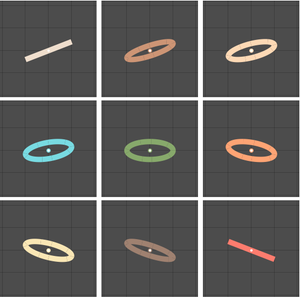
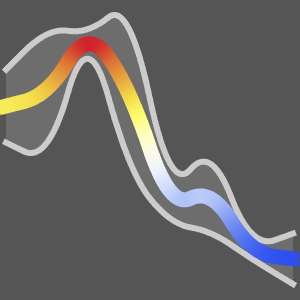
- Apply arbitrary scaling functions to any dimension in contour, density, surface and discrete plots. »
- Plots automatically adjust their settings based on the scaling functions.
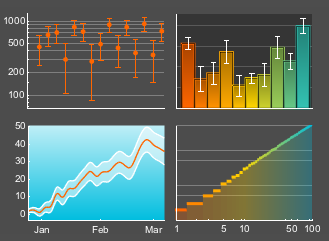
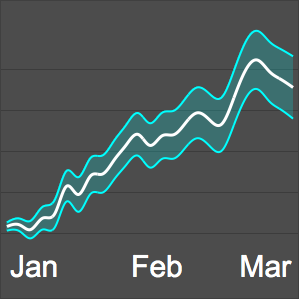
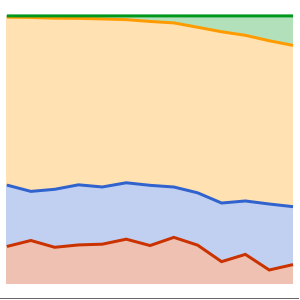
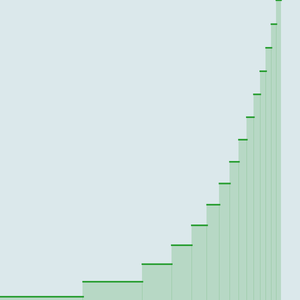
- Use stacked and percentile plot layouts to see how sets of data relate to the whole. »
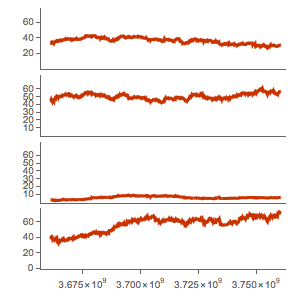
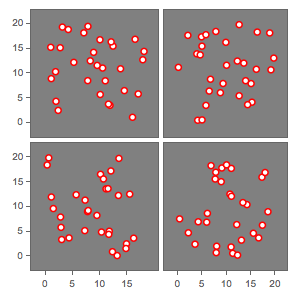
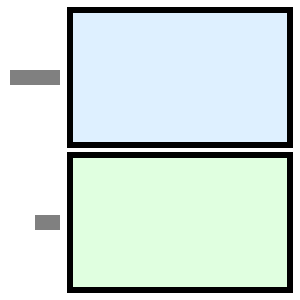
- Create grids of plots with shared axes to make individual components easier to read. »
Related Examples
Related Functions
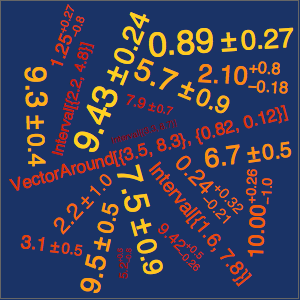
- Around
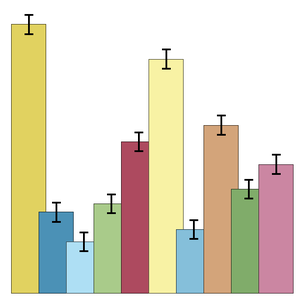
- BarChart
- ContourPlot
- ContourPlot
- DateListLogPlot
- DateListPlot
- DateListStepPlot
- DensityPlot
- DiscretePlot
- DiscretePlot3D
- GraphicsColumn
- GraphicsGrid
- GraphicsRow
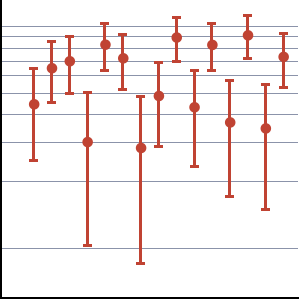
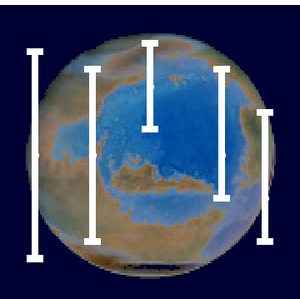
- Interval
- ListContourPlot
- ListContourPlot
- ListDensityPlot
- ListLinePlot
- ListLogLinearPlot
- ListLogLogPlot
- ListLogPlot
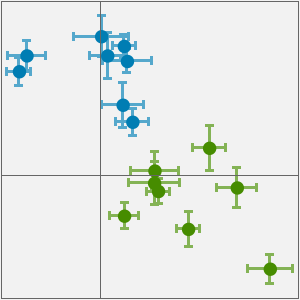
- ListPlot
- ListPlot3D
- ListPointPlot3D
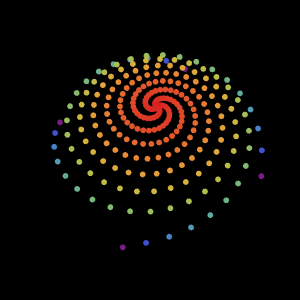
- ListPolarPlot
- ListStepPlot
- Plot3D
- StackedDateListPlot
- StackedListPlot
- VectorAround


