| 13 | Arrays, or Lists of Lists |
We
’ve seen how
Table can be used to make lists. Now let
’s see how
Table can be used to create higher-dimensional arrays of values.
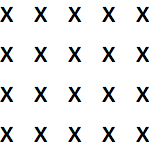
Make a list of 4 copies of x:
Make a list of 4 copies of a list that contains 5 copies of x:
Use
Grid to display the result in a grid:
You can use
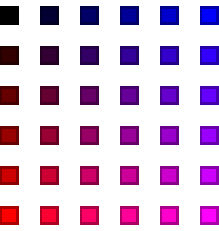
Table with two variables to make a 2D array. The first variable corresponds to the row; the second to the column.
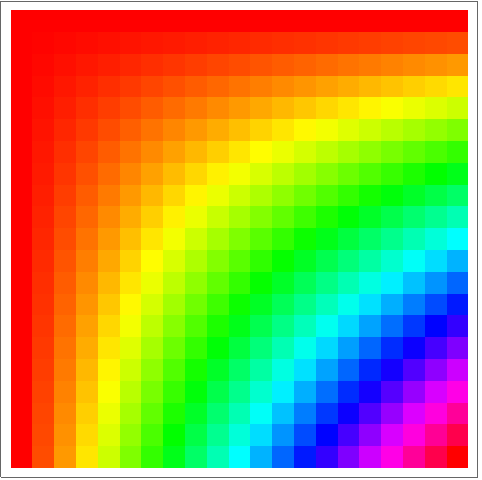
Make an array of colors: red going down, blue going across:
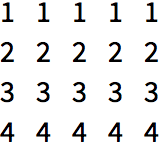
Show every array element as its row number:
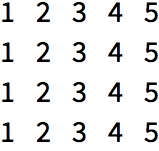
Show every array element as its column number:
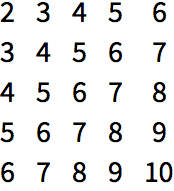
Generate an array in which each element is the sum of its row and column number:
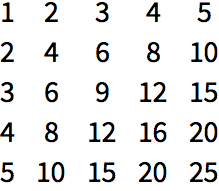
Generate a multiplication table:
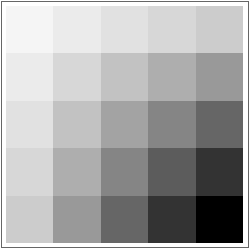
ArrayPlot lets you visualize values in an array. Larger values are shown darker.
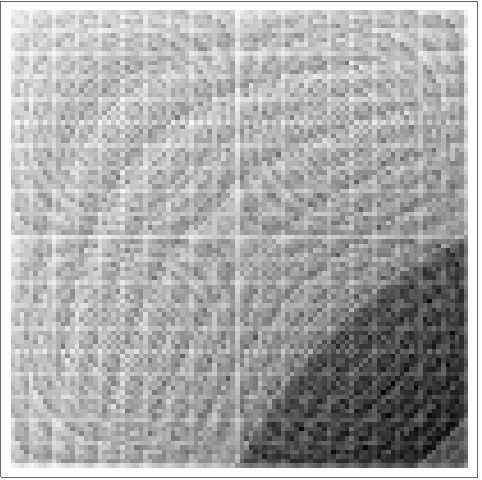
Visualize a multiplication table:
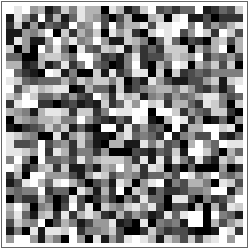
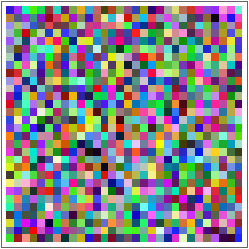
Generate and plot an array of random values:
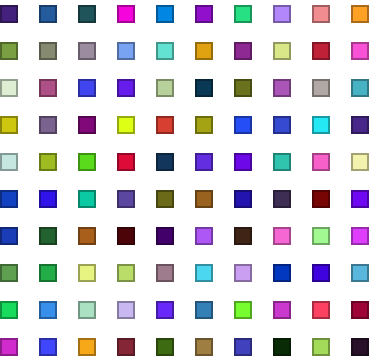
ArrayPlot also lets you put colors as values:
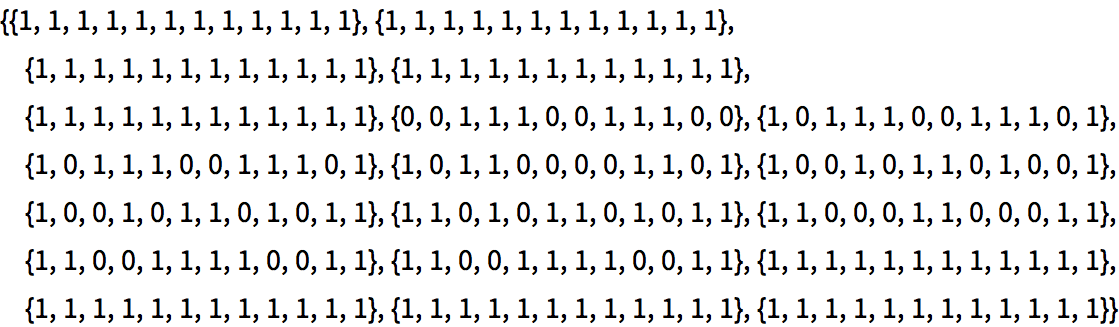
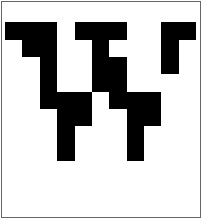
Images are ultimately arrays of pixels. Color images make each pixel have red, green and blue values. Black-and-white images have pixels with values 0 (black) or 1 (white). You can get the actual pixel values using
ImageData.
Find the value of pixels in an image of a
“W
”:
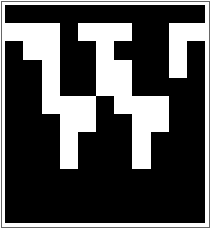
Use
ArrayPlot to visualize the array of values:
The image is of very low resolution, because that
’s how
Rasterize made it in this case. It
’s also white-on-black instead of black-on-white. That
’s because in an image 0 is black and 1 is white (like in
RGBColor), while
ArrayPlot’s default is to make larger values darker.
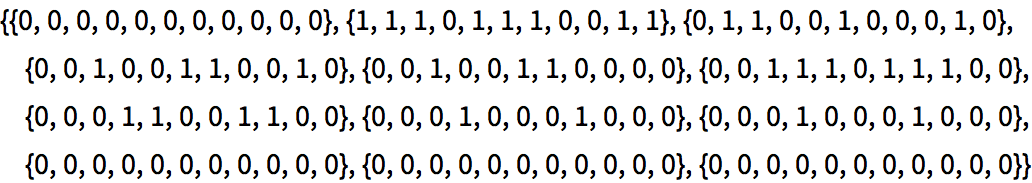
You can do arithmetic with arrays, just like lists. That means it
’s easy to swap
0 and
1 in this array: Just subtract everything from
1, so every
0 becomes
1−0=1, and every
1 becomes
1−1=0.
Find pixel values, then do arithmetic to swap 0 and 1 in the array:
The result is black-on-white:
| Table[x,4,5] | | make a 2D array of values |
| Grid[array] | | lay out values from an array in a grid |
| ArrayPlot[array] | | visualize the values in an array |
| ImageData[image] | | get the array of pixel values from an image |
13.1Make a 12
×12 multiplication table.
»
13.2Make a 5
×5 multiplication table for Roman numerals.
»
13.3Make a 10
×10 grid of random colors.
»
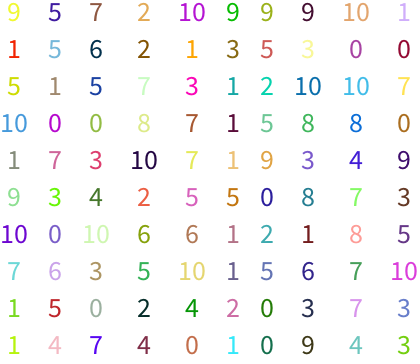
13.4Make a 10
×10 grid of randomly colored random integers between 0 and 10.
»
13.5Make a grid of all possible strings consisting of pairs of letters of the alphabet (
“aa
”,
“ab
”, etc.).
»
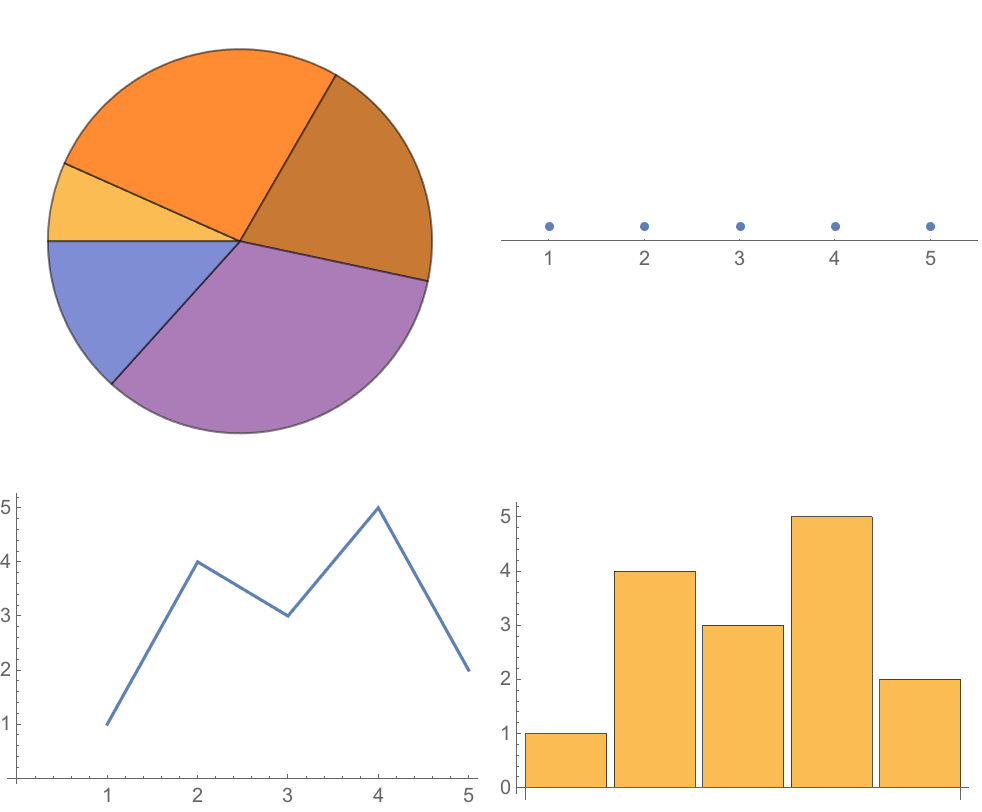
13.6Visualize
{1, 4, 3, 5, 2} with a pie chart, number line, line plot and bar chart. Place these in a 2
×2 grid.
»
13.7Make an array plot of hue values
x*y, where
x and
y each run from 0 to 1 in steps of 0.05.
»
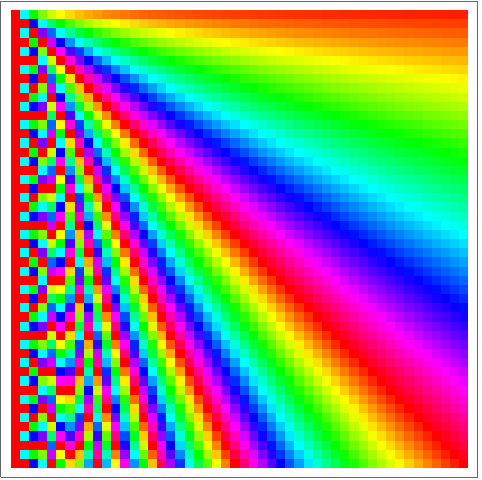
13.8Make an array plot of hue values
x/y, where
x and
y each run from 1 to 50 in steps of 1.
»
13.9Make an array plot of the lengths of Roman numeral strings in a multiplication table up to 100
×100.
»
+13.1Make a 20
×20 addition table.
»
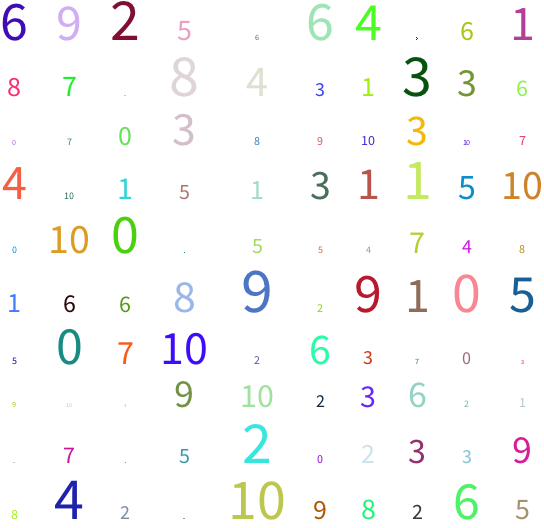
+13.2Make a 10
×10 grid of randomly colored random integers between 0 and 10 that have random size up to 32.
»
Can the limits of one variable in a table depend on another?
Yes, later ones can depend on earlier ones.
Table[x, {i, 4}, {j, i}] makes a
“ragged
” triangular array.
Can I make tables that are lists of lists of lists?
Yes, you can make tables of any dimension.
Image3D gives a way to visualize 3D arrays.
Why does 0 correspond to black, and 1 to white, in images?
0 means zero intensity of light, i.e. black. 1 means maximum intensity, i.e. white.
How do I get the original image back from the output of
ImageData?
Just apply the function
Image to it.
- Arrays in the Wolfram Language are just lists in which each element is itself a list. The Wolfram Language also allows much more general structures, that mix lists and other things.
- Lists in the Wolfram Language correspond to mathematical vectors; lists of equal-length lists correspond to matrices.
- If most of the entries in an array are 0 (or some other fixed value), you can use SparseArray to construct an array just by giving the positions and values of nonzero elements.