| 19 | Dates and Times |
In the Wolfram Language, Now gives your current date and time.
| In[1]:= |
| Out[1]= |
Add a week to the current date and time:
| In[2]:= |
| Out[2]= |
Enter a date:
| In[3]:= |
| Out[3]= |
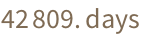
Subtract two dates:
| In[4]:= |
| Out[4]= |
| In[5]:= |
| Out[5]= |
| In[6]:= |
| Out[6]= |
DayName finds the day of the week for a particular date.
Compute the day of the week 45 days from now:
| In[7]:= |
| Out[7]= |
Once you know a date, there are lots of things you can compute. For example, MoonPhase gives the phase of the moon (or, more accurately, the fraction of the Moon that is illuminated when seen from the Earth).
Compute the phase of the moon now:
| In[8]:= |
| Out[8]= |
Compute the phase of the moon on a certain date:
| In[9]:= |
| Out[9]= |
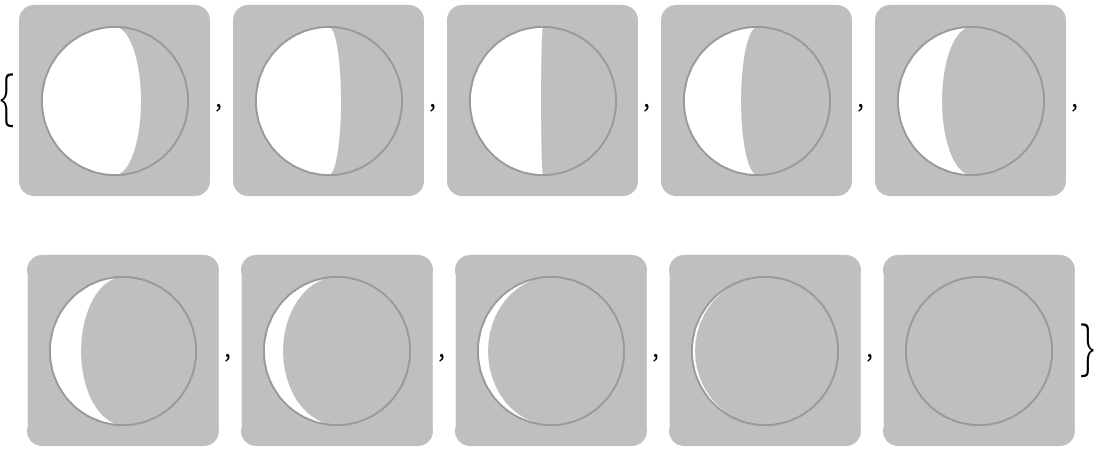
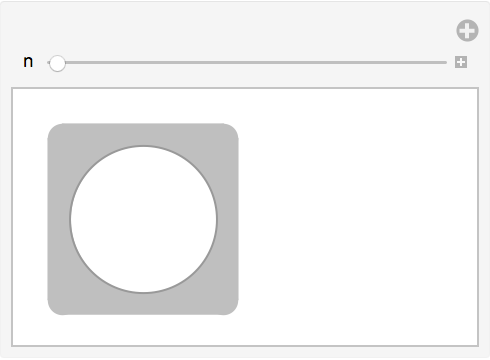
Generate an icon for the phase of the moon:
| In[10]:= |
| Out[10]= | 
|
If you know both the date and a location on Earth, you can work out when the sun will rise and set.
| In[11]:= |
| Out[11]= |
| In[12]:= |
| Out[12]= |
They’re about a minute off from being exactly 1 day (24 hours) apart:
| In[13]:= |
| Out[13]= |
Time zones are one of many subtleties. LocalTime gives the time in the time zone of a particular location.
| In[14]:= |
| Out[14]= |
| In[15]:= |
| Out[15]= |
Among the many areas where the Wolfram Language has extensive data is weather. The function AirTemperatureData uses this data to give the historical air temperature at a particular time and place.
Find the air temperature here at 6 pm yesterday:
| In[16]:= |
| Out[16]= |
If you provide a pair of dates, AirTemperatureData computes a time series of estimated temperatures between those dates.
Give a time series of air temperature measurements from a week ago until now:
| In[17]:= |
| Out[17]= |
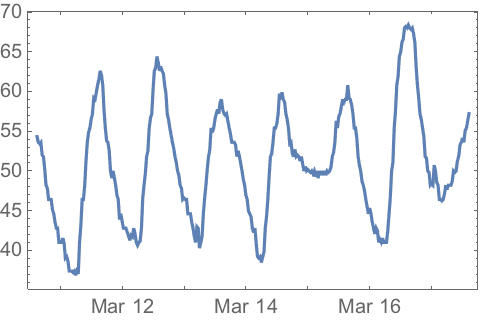
DateListPlot is the analog of ListPlot for time series, where each value occurs at a particular date.
Plot the list of air temperature measurements:
| In[18]:= |
| Out[18]= | 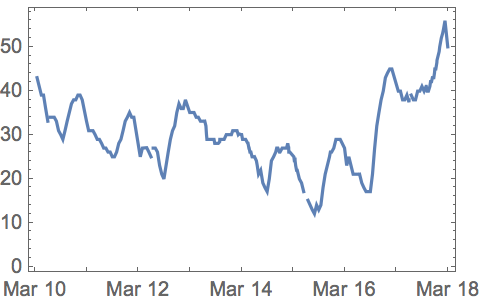
|
As another example, let’s look at data that goes much further back in time. WordFrequencyData tells one how frequently a particular word occurs, say in a sample of books published in a given year. There’s a lot of history one can see by looking at how this changes over the years and centuries.
| In[19]:= |
| Out[19]= |
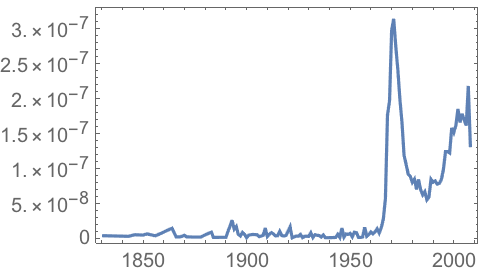
Cars started to exist around 1900, but gradually stopped being called “automobiles”:
| In[20]:= |
| Out[20]= | 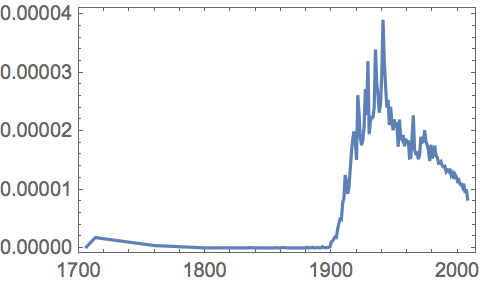
|
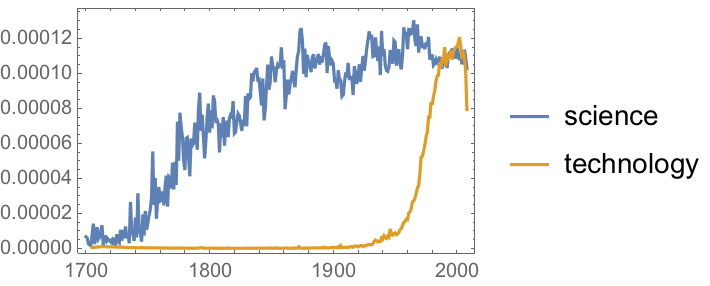
WordFrequencyData is set up to make it easy to compare frequencies of different words. Let’s see how “monarchy” and “democracy” have fared over the years. “Democracy” is definitely more popular now, but “monarchy” was more popular in the 1700s and 1800s.
Compare historical word frequency between “monarchy” and “democracy”:
| In[21]:= |
| Out[21]= | 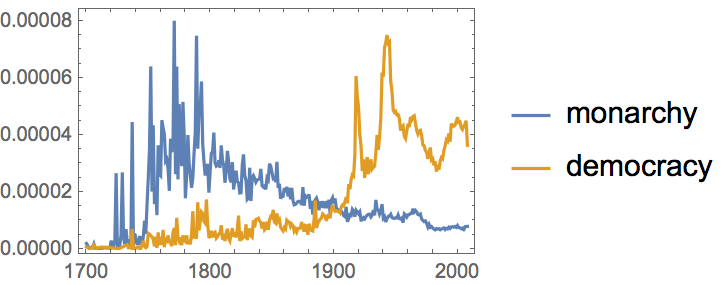
|
| Now | current date and time | |
| Today | date object for today | |
| Tomorrow | date object for tomorrow | |
| Yesterday | date object for yesterday | |
| DayRange[date1,date2] | list of dates from date1 to date2 | |
| DayName[date] | day of the week of date | |
| MoonPhase[date] | moon phase on date | |
| Sunrise[location,date] | time of sunrise on date at location | |
| Sunset[location,date] | time of sunset on date at location | |
| LocalTime[location] | current time at location | |
| AirTemperatureData[location,time] | air temperature at time at location | |
| AirTemperatureData[location,{time1,time2}] | time series of air temperatures from time1 to time2 at location | |
| DateListPlot[timeseries] | plot a time series | |
| WordFrequencyData["word","TimeSeries"] | time series of word frequencies |
19.1Compute how many days have elapsed since January 1, 1900. »

19.2Compute what day of the week January 1, 2000 was. »

19.3Find the date a hundred thousand days ago. »

19.4Find the local time in Delhi. »

19.6Generate an icon for the current phase of the moon. »

19.7Make a list of the numerical phase of the moon for each of the next 10 days. »

19.8Generate a list of icons for the moon phases from today until 10 days from now. »
19.9Compute the time today between sunrise in New York City and in London. »
19.10Find the air temperature at the Eiffel Tower at noon yesterday. »
19.11Plot the temperature at the Eiffel Tower over the past week. »
19.12Find the difference in air temperatures between Los Angeles and New York City now. »
+19.1Compute how many weeks have elapsed since January 1, 1900. »
+19.2Compute the time between 3 pm today and sunset today. »
+19.3Generate an icon of the phase of the moon on August 29, 1959. »

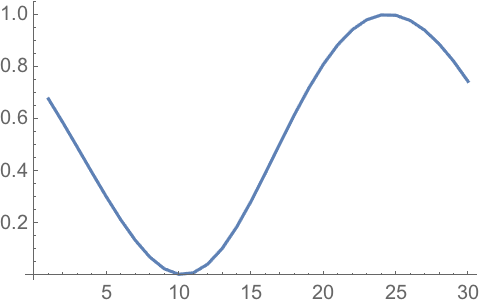
+19.4Make a line plot of the numerical phase of the moon for each of the next 30 days. »
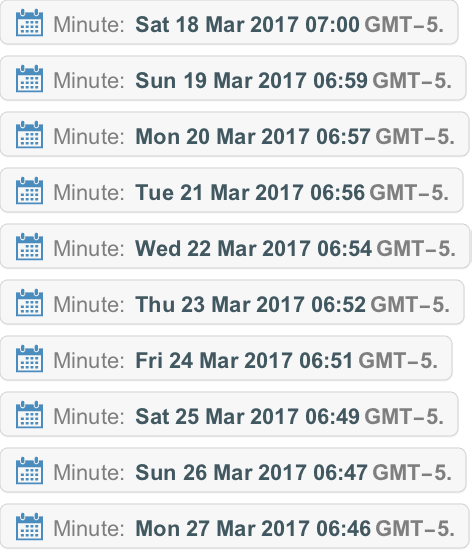
+19.6Show in a column the times of sunrise for 10 days, starting today. »
How can I get a date as a string?
Use DateString[date]. There are many options for the format of the string. For example, DateString[date, "DateShort"] uses short day and month names.
How can I extract the month or some other element from a date?
Use DateValue. DateValue[date, "Month"] gives the month number, DateValue[date, "MonthName"] gives the month name, etc.
How far in the past can dates be in the Wolfram Language?
As far as you want. The Wolfram Language knows about historical calendar systems, and the history of time zones. It also has the data to accurately compute sunrise, etc. going back at least 1000 years.
Why are sunrise and sunset given only to the minute?
Because you can’t compute more accurately than that exactly when the sun will actually rise and set without knowing things like air temperature that affect the bending of light in the Earth’s atmosphere.
Where does the Wolfram Language get air temperature data from?
The worldwide network of weather stations, located at airports and other places. If you’ve got your own air temperature measuring device, you can connect it to the Wolfram Language through the Wolfram Data Drop (see Section 43).
What is a time series?
It’s a way of specifying the values of something at a series of times. You can enter a time series in the Wolfram Language as TimeSeries[{{time1, value1}, {time2, value2}, ...}]. The Wolfram Language lets you do arithmetic and many other operations with time series.
What does DateListPlot do?
It plots values against times or dates. The values can be given in a TimeSeries[...] or in a list of the form {{time1, value1}, {time2, value2}, ...}.
- The Wolfram Language decides whether to interpret a date like 8/10/15 as month/day/year or day/month/year based on what country you’re in. You can pick the other interpretation if you want.
- Monday, etc. are symbols with intrinsic meaning, not strings.
- DateObject lets you specify the “granularity” of a date (day, week, month, year, decade, etc.). CurrentDate, NextDate, DateWithinQ, etc. operate on granular dates.
- You can see what’s “inside” DateObject[...] using InputForm.