Many functions in the Wolfram Language have
options that determine the details of how they work. For example, in making a plot, you can use
PlotTheme"Web" to use a web-oriented visual theme. On a keyboard, the
is automatically formed if you type
-> (i.e.
- followed by
>)
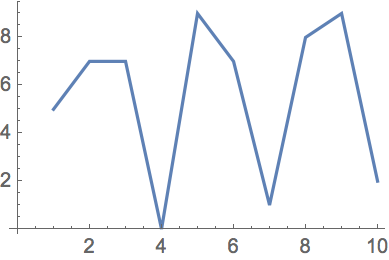
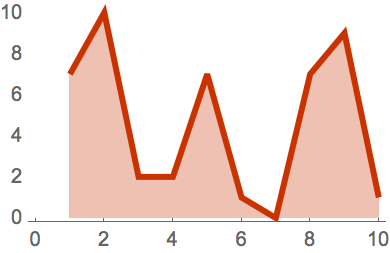
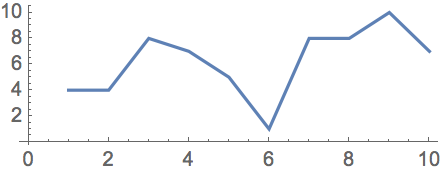
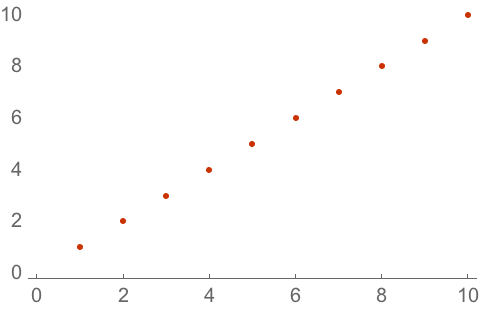
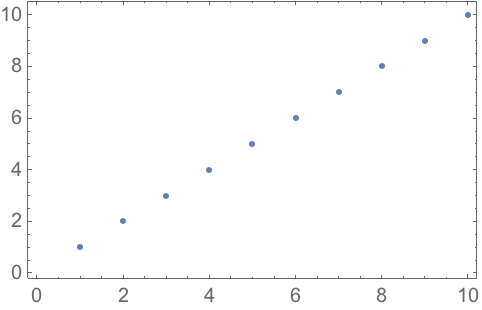
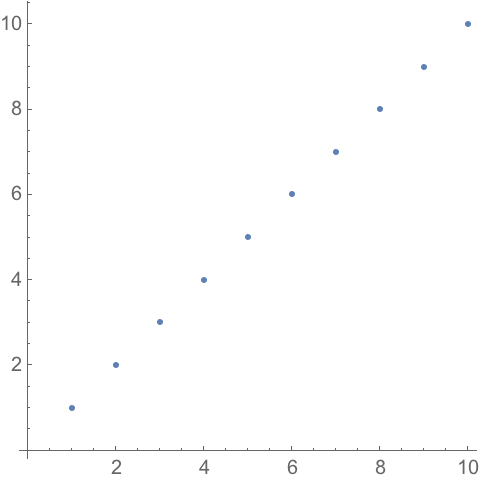
.A standard plot, with no options given:
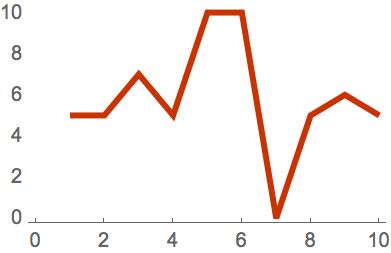
A plot with the
PlotTheme option given as
"Web":
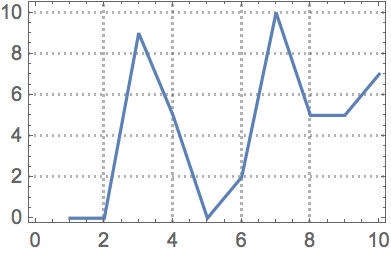
A plot with the
PlotTheme option given as
"Detailed":
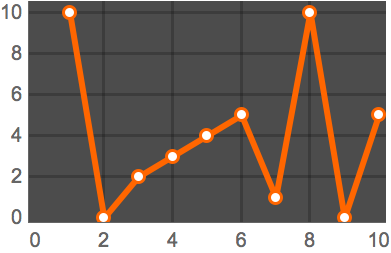
A plot with the
PlotTheme option given as
"Marketing":
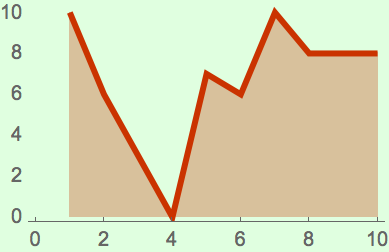
You can add more options. For example,
Filling specifies what filling to add to a plot.
Fill the plot to the axis:
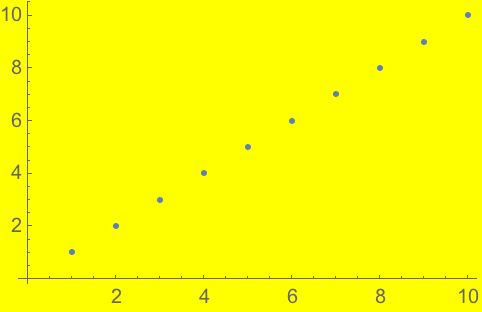
Background lets you specify a background color.
Also include an option for background color:
If you don
’t mention a particular option, the Wolfram Language will use a pre-defined default for that option. Most often that default is
Automatic, which means that the language will automatically determine what to do.
One option that
’s often useful for graphics is
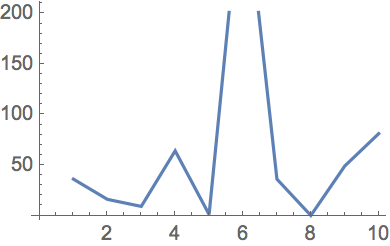
PlotRange, which specifies what range of values to include in a plot. With the default
PlotRangeAutomatic, the system will try to automatically show the
“interesting
” part of the plot.
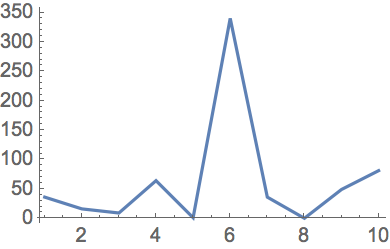
PlotRangeAll shows all values.
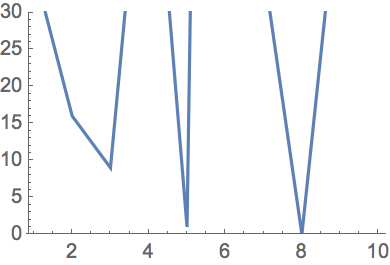
With default options all but one
“outlier
” value are displayed:
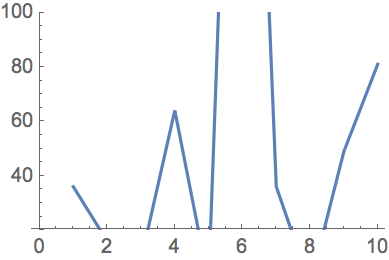
PlotRange{20, 100} specifies to show values between 20 and 100:
You can specify ranges for all types of graphics. In
GeoListPlot and
GeoGraphics you can use the option
GeoRange to specify what part of the world to include in a plot.
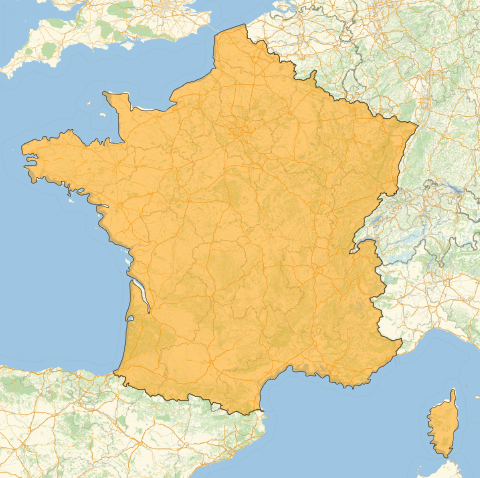
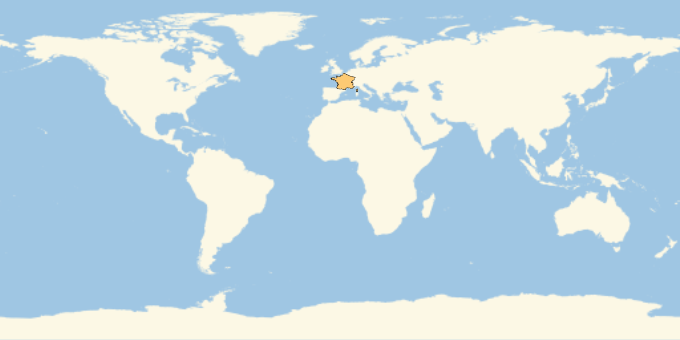
By default, a geo plot of France pretty much includes only France:
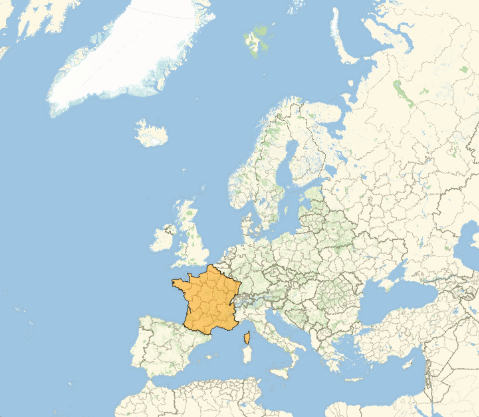
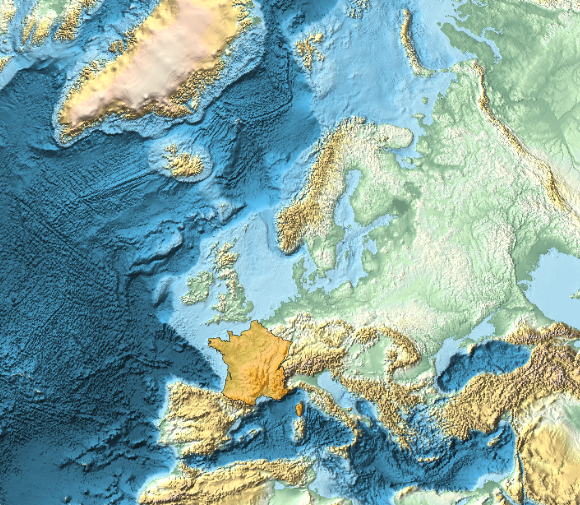
This requests a range that includes all of Europe:
There are many other options for
GeoListPlot. For example
GeoBackground specifies what kind of background should be used.
GeoLabels adds labels.
Joined makes the points be joined.
Use a relief map as the background:
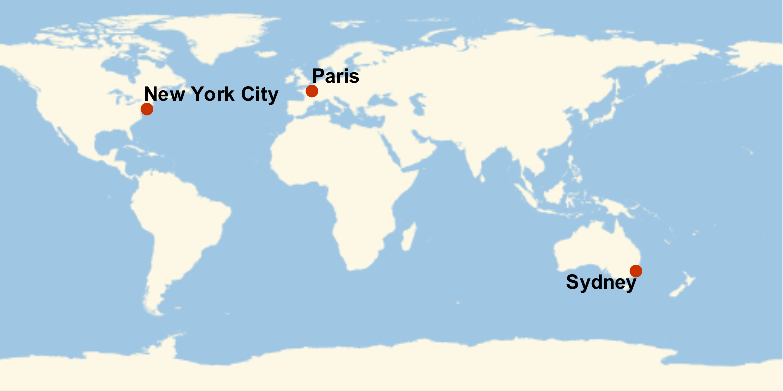
Automatically add labels for geo objects:
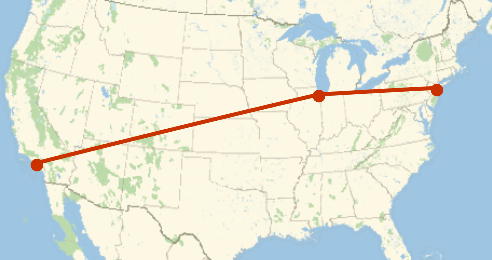
Say it
’s
True that the points should be joined:
The function
ListLinePlot has 57 different options you can set;
GeoListPlot has 54. Some options are common to all graphics functions. For example,
AspectRatio determines the overall shape of graphics, specifying the ratio of height to width.
With an aspect ratio of 1/3, the plot is 3 times wider than it is tall:
The option
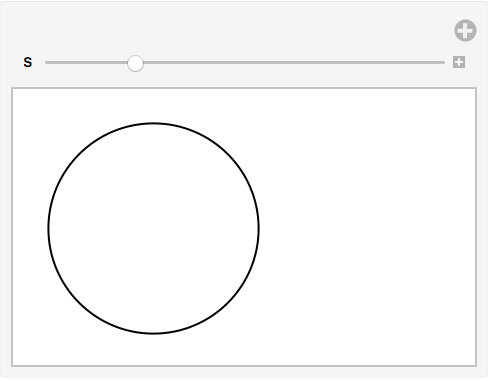
ImageSize specifies the overall size of graphics.
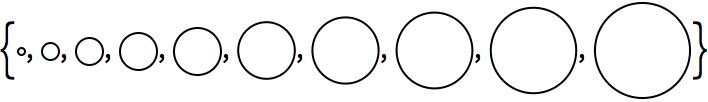
Draw a circle with a
“tiny
” overall image size:
Draw circles with specific image sizes between 5 and 50 pixels:
It
’s not just
Graphics that allows options. Lots of other functions do too. An example is
Style, which supports many options.
Set an option to use "
Chalkboard" font to style text:
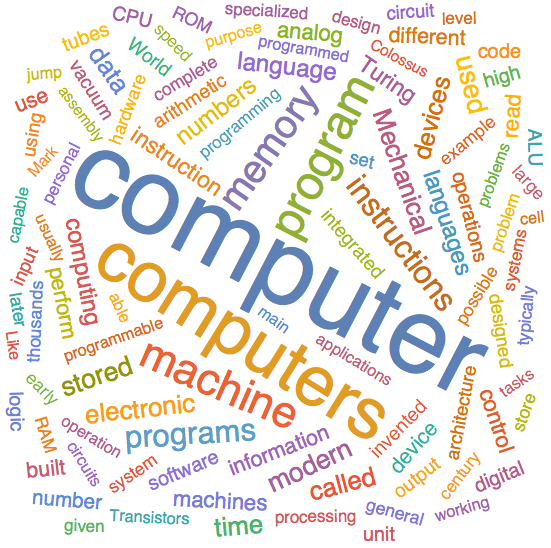
It
’s quite common for options to describe details of output, for example in
WordCloud.
Create a word cloud with random word orientations:
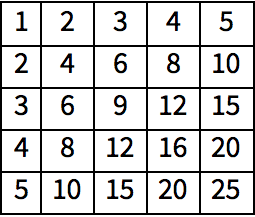
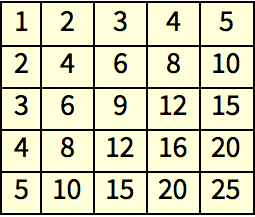
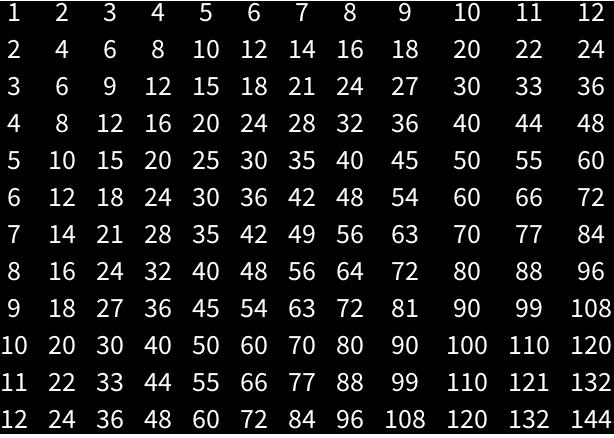
Grid has many options. The
Frame option controls whether and how a frame is drawn.
Create a multiplication table with a frame around each entry:
| PlotTheme | | theme for a plot (e.g. "Web", "Detailed", etc.) |
| Filling | | filling to add to a plot (Axis, Bottom, etc.) |
| PlotRange | | range of values to include in a plot (All, etc.) |
| GeoRange | | geo range to include (All, specific country, etc.) |
| GeoBackground | | background map ("ReliefMap", "OutlineMap", etc.) |
| GeoLabels | | labels to add to a map (e.g. Automatic) |
| Joined | | whether to make points be joined (True, False) |
| Background | | background color |
| AspectRatio | | ratio of height to width |
| ImageSize | | size in pixels |
| Frame | | whether to include a frame (True, All, etc.) |
| FontFamily | | family of font to use (e.g. "Helvetica") |
| WordOrientation | | how to orient words in a word cloud |
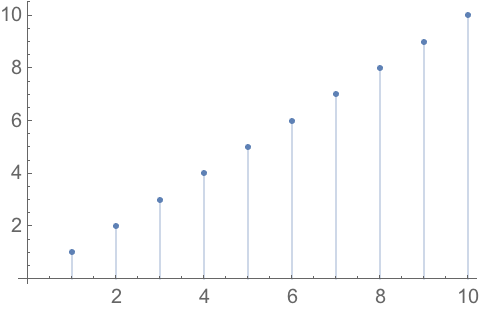
20.1Create a list plot of
Range[10] themed for the web.
»
20.2Create a list plot of
Range[10] with filling to the axis.
»
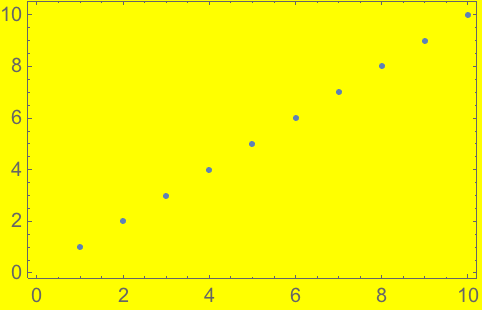
20.3Create a list plot of
Range[10] with a yellow background.
»
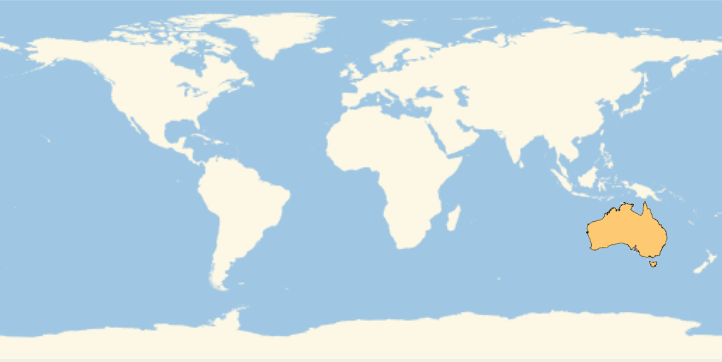
20.4Create a map of the world with Australia highlighted.
»
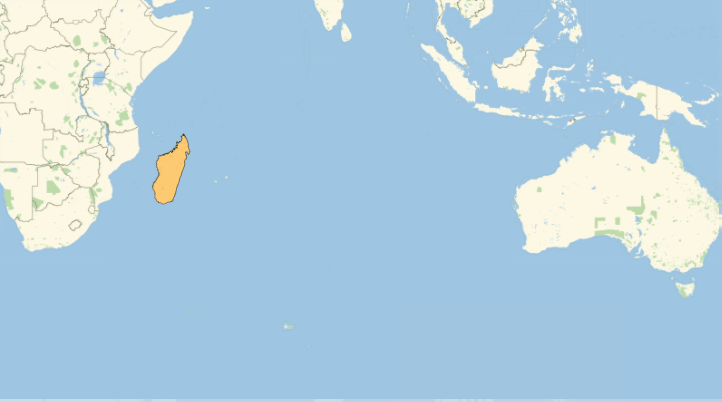
20.5Create a map of the Indian Ocean with Madagascar highlighted.
»
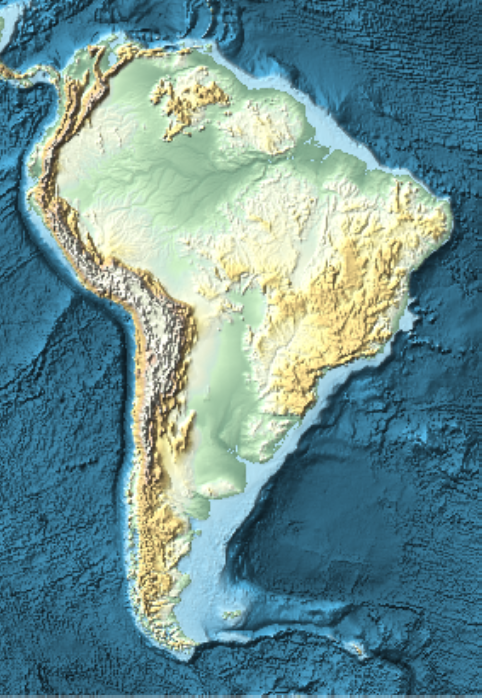
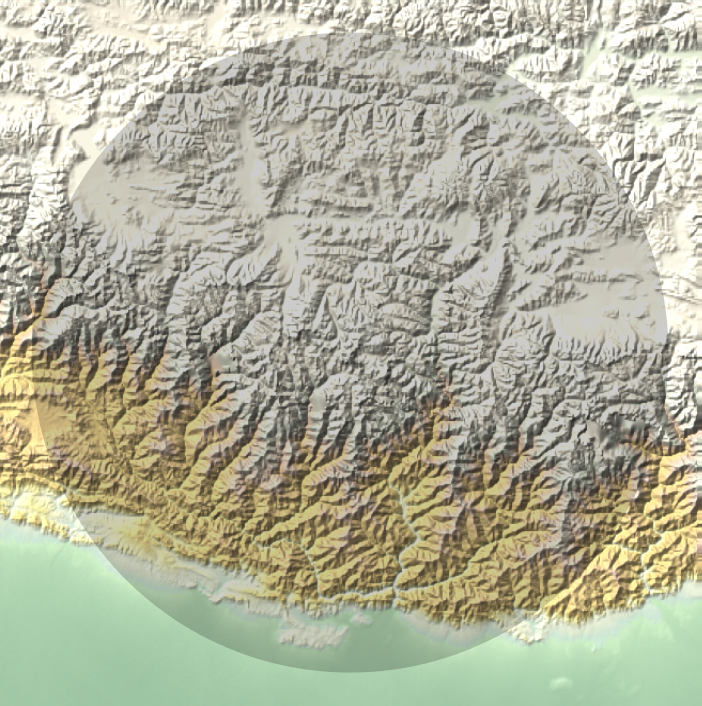
20.6Use
GeoGraphics to create a map of South America showing topography (relief map).
»
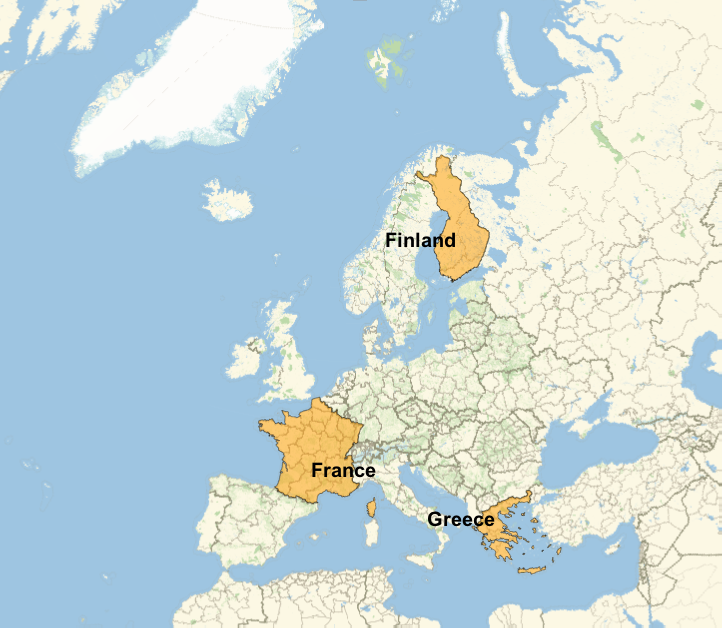
20.7Make a map of Europe with France, Finland and Greece highlighted and labeled.
»
20.8Make a 12
×12 multiplication table as a grid with white type on a black background.
»
20.9Make a list of 100 disks with random integer image sizes up to 40.
»
20.10Make a list of pictures of regular pentagons with image size 30 and aspect ratios from 1 to 10.
»
20.11Make a
Manipulate that varies the size of a circle between 5 and 500.
»
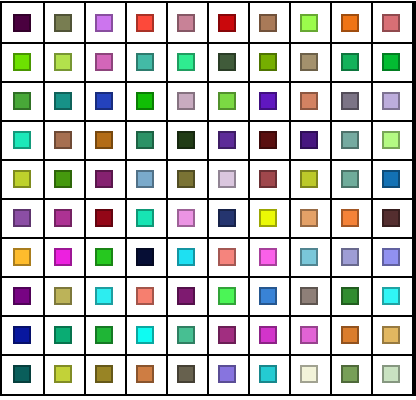
20.12Create a framed 10
×10 grid of random colors.
»
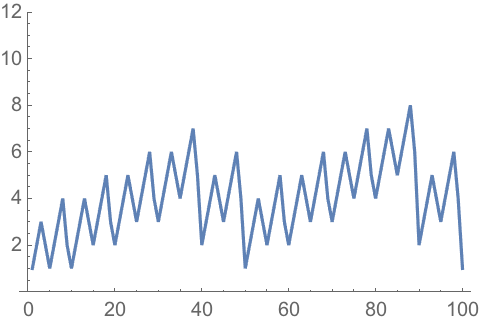
20.13Make a line plot of the lengths of Roman numerals up to 100, with a plot range that would be sufficient for all numerals up to 1000.
»
+20.1Create a list plot of
Range[10] with a frame included.
»
+20.2Create a list plot of
Range[10] with a yellow background and a frame.
»
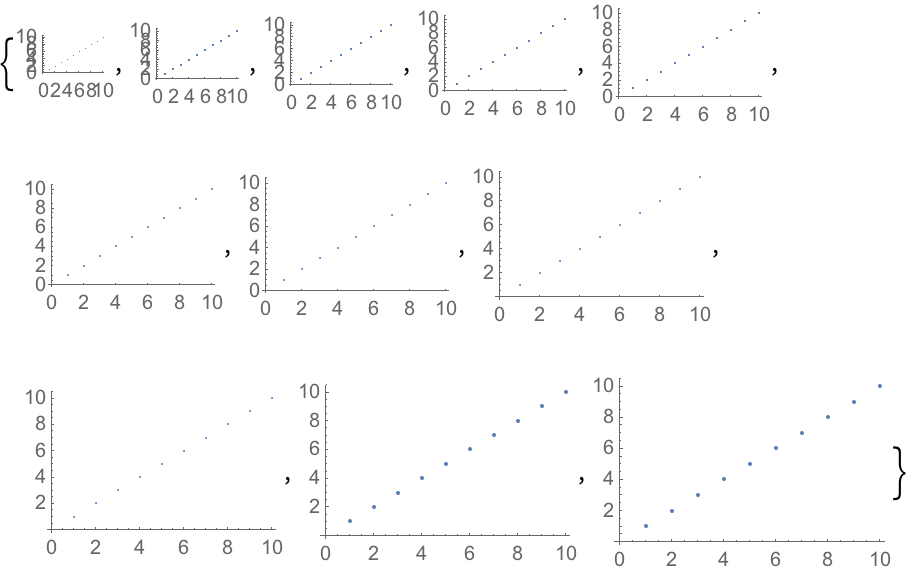
+20.3Make a list of list plots of
Range[10], with sizes ranging from 50 to 150 in steps of 10.
»
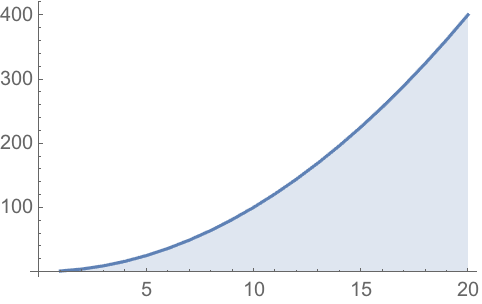
+20.4Make a line plot of the first 20 squares, filling to the axis.
»
+20.5Create a relief map of the region around Mount Everest, drawing a disk of radius 100 miles.
»
+20.6Create a list plot of
Range[10] with an aspect ratio of 1.
»
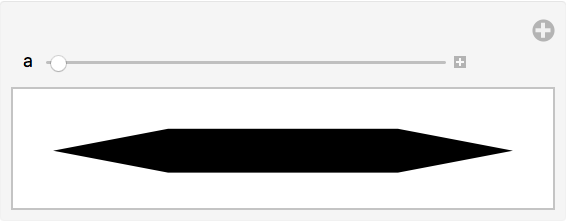
+20.7Make a
Manipulate that varies the aspect ratio of a picture of a regular hexagon from 0.1 to 5.
»
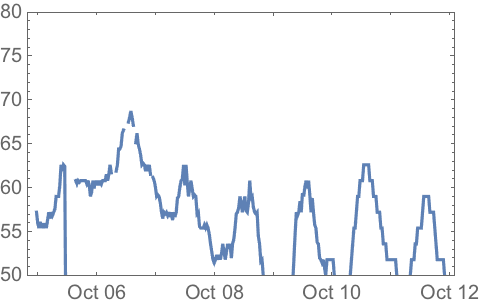
+20.8Make a plot of the air temperature in Paris over the past week with the plot range restricted between 50 and 80 degrees.
»
How can I get a list of the options for a function?
Look at the
documentation. Or use for example
Options[WordCloud]. Also, whenever you start typing the name of an option, you
’ll see a menu of possible completions.
How do I find out the possible settings for an option?
Look at the documentation for that option. Also, when you type
, you
’ll typically get a menu of possible common settings.
What is
optvalue internally?
It
’s
Rule[opt, value]. Rules are used in lots of places in the Wolfram Language.
ab is usually read aloud as
“a goes to
b” or
“a arrow
b”.
When are values of options given as strings?
Only a small set of standard option settings (such as
Automatic,
None and
All) are not strings. Specialized settings for particular options are normally strings.
Can one reset the default for an option?
Yes, using
SetOptions. Though you have to be careful not to forget that you
’ve done it.