
Plots in 2D
Generate a 2D plot of a polynomial function:
(The interval notation of {x,min,max} defines the domain.)| In[1]:= |
| Out[1]= | 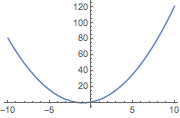 |
Or plot a 2D region for a set of inequalities:
(&& is the symbol for And.)| In[2]:= |
| Out[2]= | 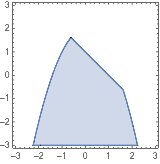 |
There are lots of useful options to customize visualizations, like adding legends:
| In[1]:= |
| Out[1]= | 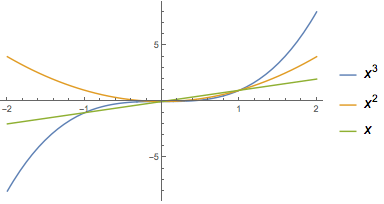 |
Or filling a plot to visualize the area under a curve:
| In[2]:= |
| Out[2]= | 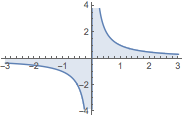 |
Combine different plot types with Show:
| In[1]:= |
| Out[1]= | 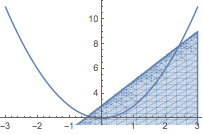 |
QUICK REFERENCE: Function Visualization »
QUICK REFERENCE: Graphics Options & Styling »