Modelos interactivos
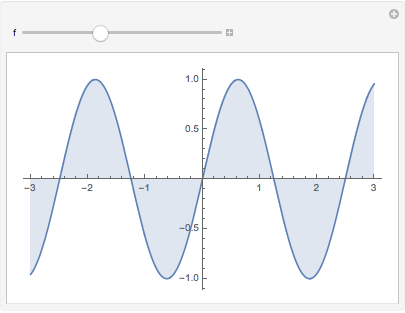
El comando Manipulate te permite explorar de forma interactiva lo que sucede cuando varias los parámetros en tiempo real:
| In[1]:= |
| Out[1]= |  |
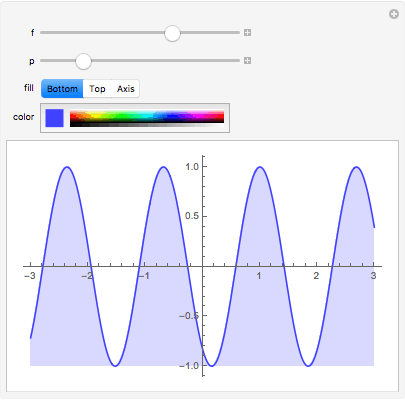
Un sólo comando Manipulate puede tener múltiples controladores, y Wolfram Language automáticamente selecciona la mejor presentación de esos controladores:
| In[1]:= |
| Out[1]= |  |
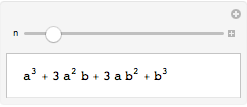
Cualquier expresión en Wolfram Language puede ser manipulada, incluyendo las expresiones no gráficas:
| In[1]:= |
| Out[1]= |  |
REFERENCIA RÁPIDA: Visualización dinámica »

