This page requires that JavaScript be enabled in your browser.
Learn how »
Mathematica Graphics for Presenting Multidimensional Evidence
Robert Yerex
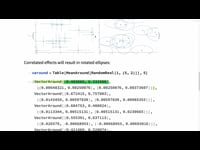
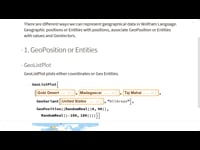
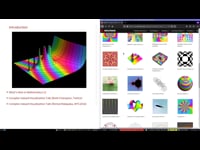
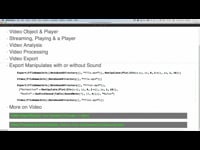
Robert Yerex, chief economist at Kronos and creator of the Retail Labor Index, explained how he uses Mathematica to develop effective multidimensional infographics about trends in employment and retail sales at the Wolfram Technology Conference 2010.
Thanks for your feedback.
Channels: Technology Conference
1311 videos match your search.
 |
Gerald Thomas |
 |
William Lewis |
 |
David Smrcka & Jan Riha |
 |
Pavla Sretrova, Vit Prochazka & Jan Riha |
 |
Rodrigo A. Obando |
 |
Marco Thiel & Diego Zviovich |
 |
Peter Jacobse |
 |
Ruhi Shah |
 |
Brett Champion |
 |
Emmanuel Garces |
 |
Nirmal Malapaka |
 |
Shadi Ashnai |
 |
Giulio Alessandrini & Mikayel Egibyan |
 |
Suba Thomas |
 |
Min Hsuan Peng |
 |
Flip Philips |
 |
Fahim Chandurwala |
 |
Anthony Zupnik |
 |
Piotr Wendykier |
 |
Tom Wickham Jones |
