This page requires that JavaScript be enabled in your browser.
Learn how »
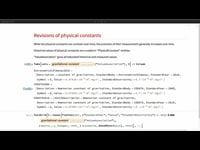
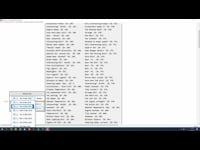
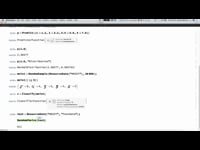
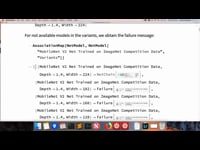
Mathematica Graphics for Presenting Multidimensional Evidence
Robert Yerex
Robert Yerex, chief economist at Kronos and creator of the Retail Labor Index, explained how he uses Mathematica to develop effective multidimensional infographics about trends in employment and retail sales at the Wolfram Technology Conference 2010.
Thanks for your feedback.
Channels: Technology Conference
1311 videos match your search.
 |
Adam Strzebonski |
 |
Tigran Ishkhanyan |
 |
Jonathan Gorard |
 |
Jaebum Jung |
 |
Charles Pooh |
 |
Mark Sofroniou |
 |
Jan Brugard |
 |
Ankit Naik |
 |
Amir Azadi |
 |
Timothee Verdier |
 |
Jose Martin-Garcia & Chris Carlson |
 |
Rob Raguet-Schofield & Jason Harris |
 |
Eric Weisstein |
 |
Andrew Steinacher |
 |
Jon McLoone |
 |
Etienne Bernard |
 |
Tuseeta Banerjee |
 |
Rafal Chojna & Sean Cheren |
 |
John Cassel |
 |
Maksim Piskunov & Jonathan Gorard |
