This page requires that JavaScript be enabled in your browser.
Learn how »
General Visualization Quick Start
Brett Champion
This course explores Mathematica's built-in tools for creating visualizations from functions or data. You'll learn how to customize plots with styles, labels, and other features that are common across the visualization functions.
Thanks for your feedback.
Channels: Virtual Events
701 videos match your search.
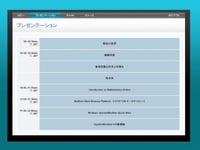 |
ウルフラム リサーチ アジア リミティッドのリージョナル オフィス マネージャー,中村英史がWolframバーチャルコンファレンスJapan 2015にご参加の皆様への開会のご挨拶を申し上げ,本日のプログラムについてかいつまんでご紹介いたします. |
 |
同志社大学 生命医科学部 教授 伊藤利明 |
 |
同志社大学 学習支援・教育開発センター 澤宏司・趙智英 |
 |
|
 |
|
 |
|
 |
|
 |
|
 |
|
 |
|
 |
|
 |
|
 |
|
 |
|
 |
|
 |
|
 |
|
 |
|
 |
|
 |
|
