This page requires that JavaScript be enabled in your browser.
Learn how »
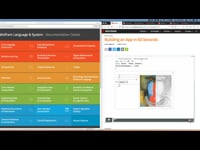
General Visualization Quick Start
Brett Champion
This course explores Mathematica's built-in tools for creating visualizations from functions or data. You'll learn how to customize plots with styles, labels, and other features that are common across the visualization functions.
Thanks for your feedback.
Channels: Virtual Events
701 videos match your search.
 |
Dylan Boliske |
 |
Leonid Shifrin |
 |
Jaebum Jung |
 |
Gosia Konwerska |
 |
Andrew Steinacher |
 |
Gosia Konwerska |
 |
Brian Wood |
 |
|
 |
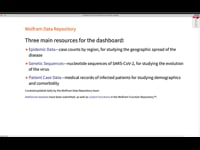
With the use of a curated dataset from the Wolfram Data Repository, this course shows how to quickly visualize different data structures and how to make your graphics ready to ... |
 |
With the use of a curated dataset from the Wolfram Data Repository, this course shows how to quickly visualize different data structures and how to make your graphics ready to ... |
 |
|
 |
|
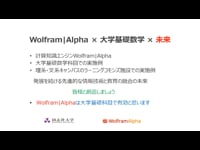 |
同志社大学 生命医科学部 教授 伊藤利明 |
 |
ウルフラムリサーチアジアリミティッド 金光安芸子 |
 |
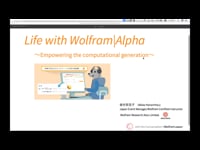
同志社大学 生命医科学部 伊藤利明 |
 |
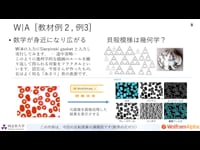
同志社大学 学習支援・教育開発センター 澤宏司・趙智英 |
 |
Overview Presentation with Jon McLoone |
 |
Shadi Ashnai, Manager of Sound and Vision, presents new video processing functionality as well as the latest features for image, audio and speech computation. |
 |
|
 |
|
