This page requires that JavaScript be enabled in your browser.
Learn how »
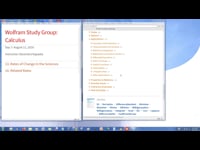
Creating Rich Visualizations to Explore Your Data
Brett Champion
Harness the power of Mathematica to interactively visualize your data. This Wolfram Mathematica Virtual Conference 2011 course features a series of examples that show how to create a rich interface for exploring data in depth.
Thanks for your feedback.
Channels: Virtual Events
701 videos match your search.
 |
|
 |
|
 |
|
 |
|
 |
|
 |
Gemelos Digitales para la toma de decisiones en políticas públicas ante el COVID19, investigación médica y negocios. |
 |
|
 |
|
 |
|
 |
|
 |
|
 |
|
 |
|
 |
|
 |
|
 |
|
 |
|
 |
|
 |
|
 |
|
