This page requires that JavaScript be enabled in your browser.
Learn how »
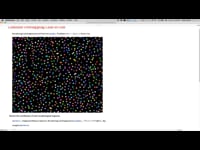
Visualization: Data Visualization Quick Start (German)
Harness the power of Mathematica to interactively visualize your data. This video features a series of examples that show how to create a rich interface for exploring data in depth. Includes German audio.
Thanks for your feedback.
Channels: Virtual Events
701 videos match your search.
 |
This talk walks you through the project workflow of real-world image processing applications using the latest Wolfram Language functionality. |
 |
|
 |
|
 |
|
 |
|
 |
|
 |
|
 |
|
 |
|
 |
|
 |
|
 |
|
 |
|
 |
|
 |
|
 |
|
 |
|
 |
|
 |
|
 |
|
