This page requires that JavaScript be enabled in your browser.
Learn how »
Representación y despliegue de datos
La arquitectura simbólica y dinámica del Wolfram Language hace posible un exclusivo y flexible enfoque para la visualización gráfica de la información. Esta charla se centrará en la representación gráfica de datos en 2D y 3D, grafos, visualizaciones dinámicas, generación de informes y despliegue de esta información para su publicación o distribución en varios medios, tanto físicos como virtuales.
Thanks for your feedback.
Channels: Spanish
65 videos match your search.
 |
This tutorial screencast encourages users to work along in Mathematica 7 as they learn the basics to create their first notebook, calculations, visualizations, and interactive examples. Includes Spanish audio. |
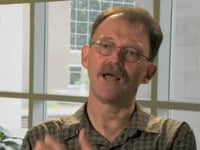 |
Frank Scherbaum Geophysics professor Frank Scherbaum walks through an example of how he used Mathematica to develop an integrated system for students, teachers, and researchers to use in their probabilistic seismic hazard ... |
 |
This screencast helps you get started using Mathematica by introducing some of the most basic concepts, including entering input, understanding the anatomy of functions, working with data and matrix operations, ... |
 |
Abby Brown Mathematica gives students the power to manipulate interactive graphics and develop complex data models. High-school teacher Abby Brown shares the success she experiences by using Mathematica in her classroom. Includes ... |
 |
Andrew Hull This video features Mathematica user Andrew Hull, who explains how Mathematica is used to develop eco-friendly biofuel solutions. Includes Spanish audio. |
