View the Distribution of Earthquakes
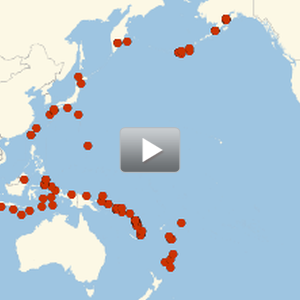
Plot the frequency of earthquakes around the world over 10 years.
In[1]:=
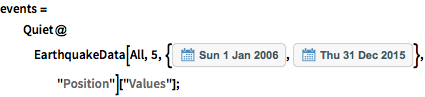
events = Quiet@
   EarthquakeData[All,
     5, {DateObject[{2006, 1, 1}], DateObject[{2015, 12, 31}]},
     "Position"]["Values"];
In[2]:=
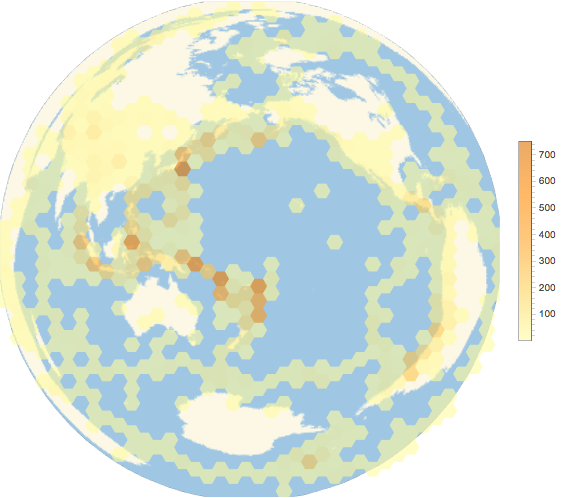
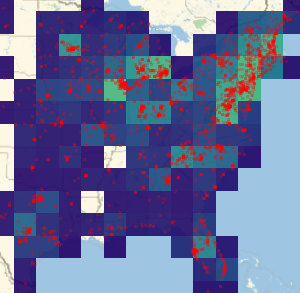
GeoHistogram[events, 50, GeoRange -> "World",
 PlotLegends -> Automatic, ImageSize -> 500]
Out[2]=
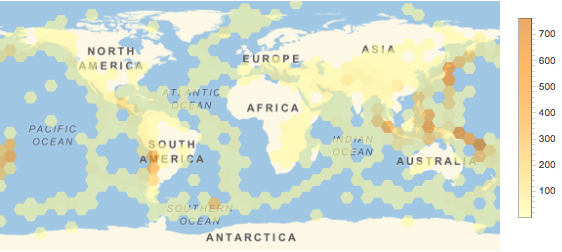
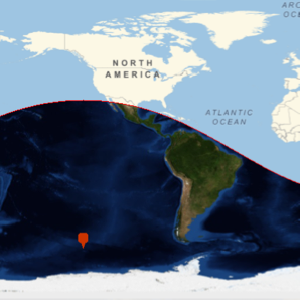
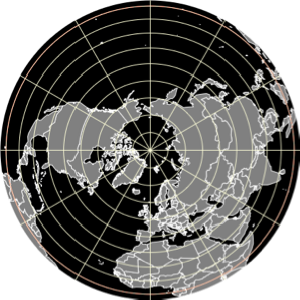
The Lambert azimuthal projection is area preserving, so all the hexagons represent the same amount of surface area on the Earth. Here the map is centered in the middle of the Ring of Fire, where the majority of the world's earthquakes occur.
In[3]:=
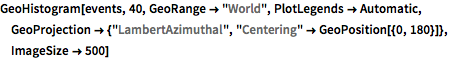
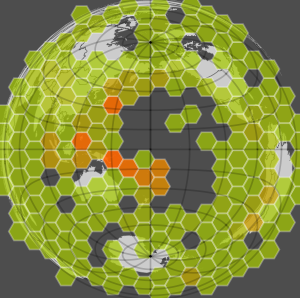
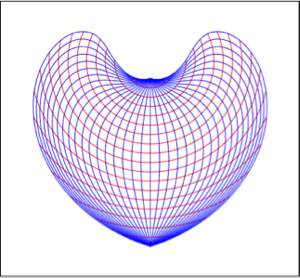
GeoHistogram[events, 40, GeoRange -> "World",
 PlotLegends -> Automatic,
 GeoProjection -> {"LambertAzimuthal",
   "Centering" -> GeoPosition[{0, 180}]}, ImageSize -> 500]
Out[3]=