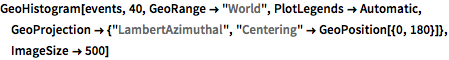
地震の分布を見る
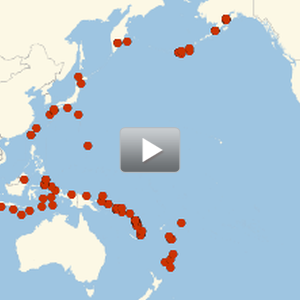
10年間に世界で起きた地震の頻度をプロットする.
In[1]:=
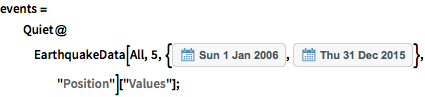
events = Quiet@
   EarthquakeData[All,
     5, {DateObject[{2006, 1, 1}], DateObject[{2015, 12, 31}]},
     "Position"]["Values"];
In[2]:=
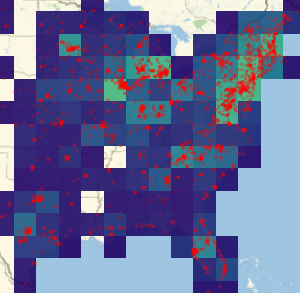
GeoHistogram[events, 50, GeoRange -> "World",
 PlotLegends -> Automatic, ImageSize -> 500]
Out[2]=
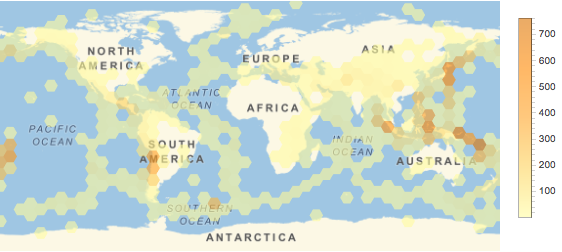
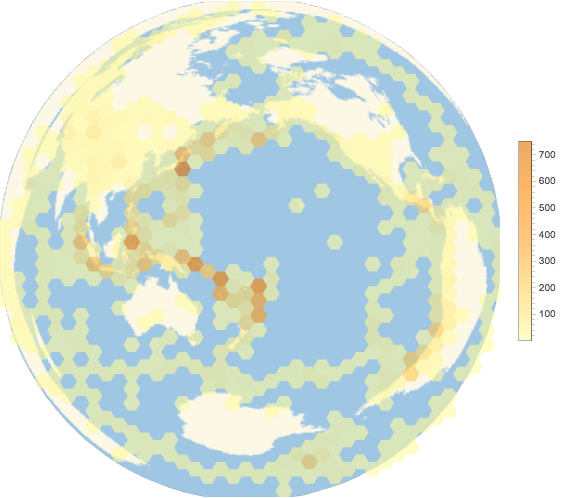
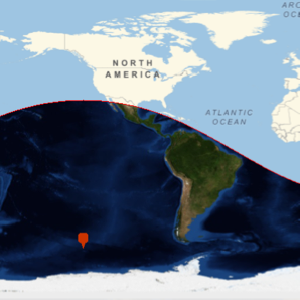
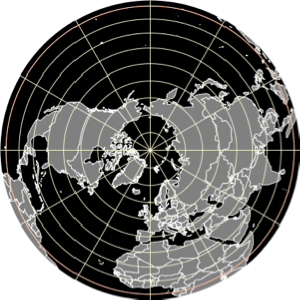
ランベルト正積方位図法は面積が正しく表示されるので,すべての六角形が地球上の同じ表面積を表す.ここでは,世界の地震の大部分が発生している環太平洋火山帯を地図の中心に置く.
In[3]:=
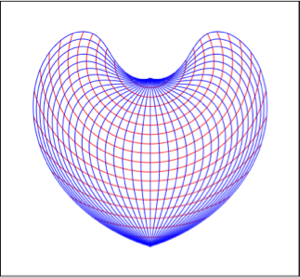
GeoHistogram[events, 40, GeoRange -> "World",
 PlotLegends -> Automatic,
 GeoProjection -> {"LambertAzimuthal",
   "Centering" -> GeoPosition[{0, 180}]}, ImageSize -> 500]
Out[3]=