
All Classes and Courses
Browse the catalog for self-paced interactive courses, video lessons and video courses, as well as scheduled instructor-led sessions, study groups, webinars and special events.
Click any button to browse all catalog resources in a particular area or use the filters to refine your search. Learn about the different course types.

Turn Rough Ideas into Computation with Wolfram Notebook Assistant

AI in Business: From Ideas to Action
An Elementary Introduction to Wolfram Language

Computation with Structured Data
Computational Chemistry and Bioscience with Wolfram Language

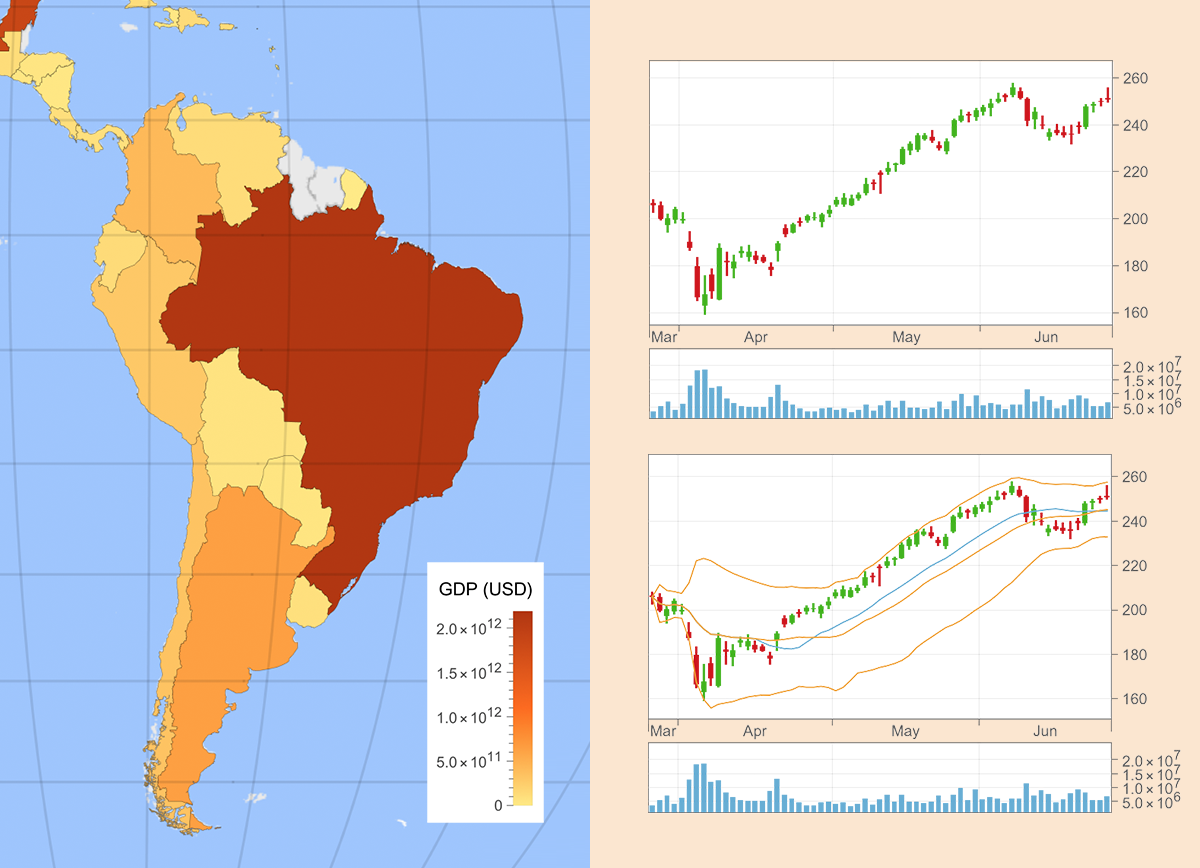
Computational Economics with Wolfram Language
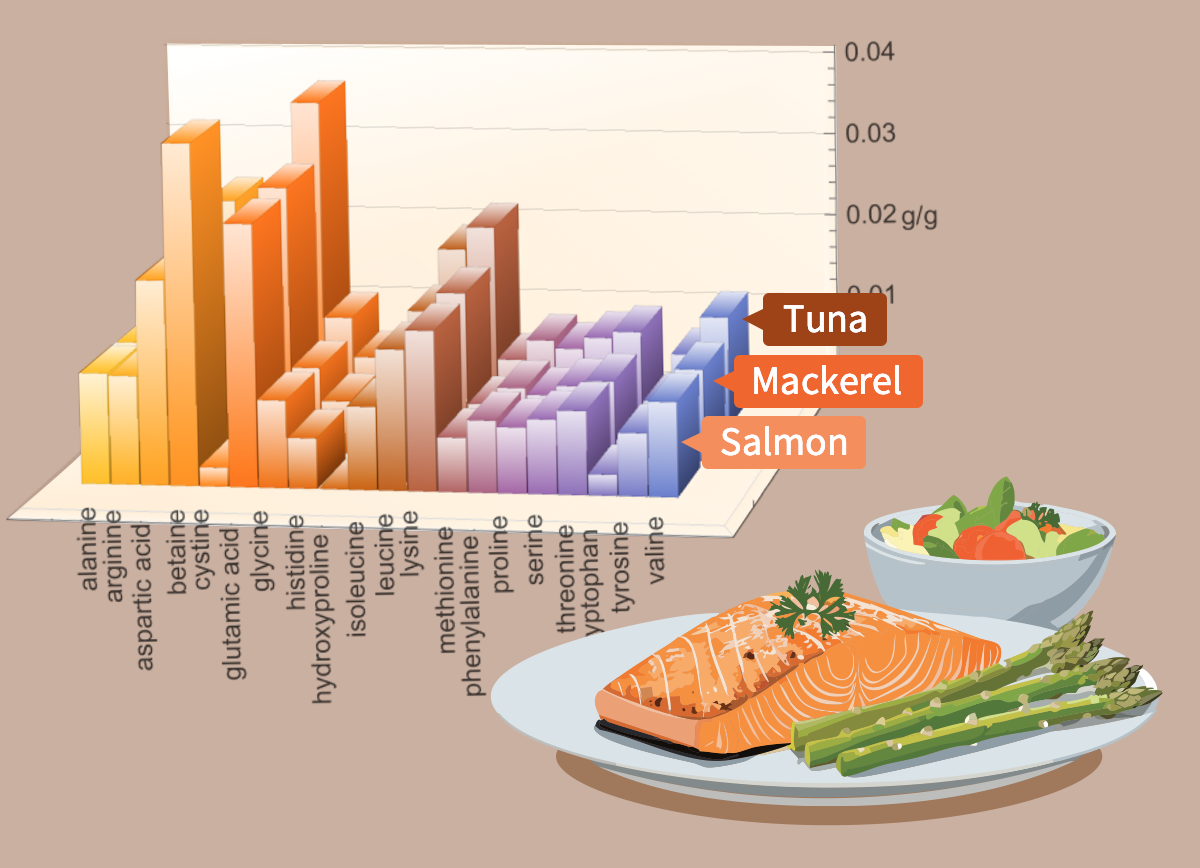
Computational Food and Nutrition
Computational Physics and Astrophysics with Wolfram Language

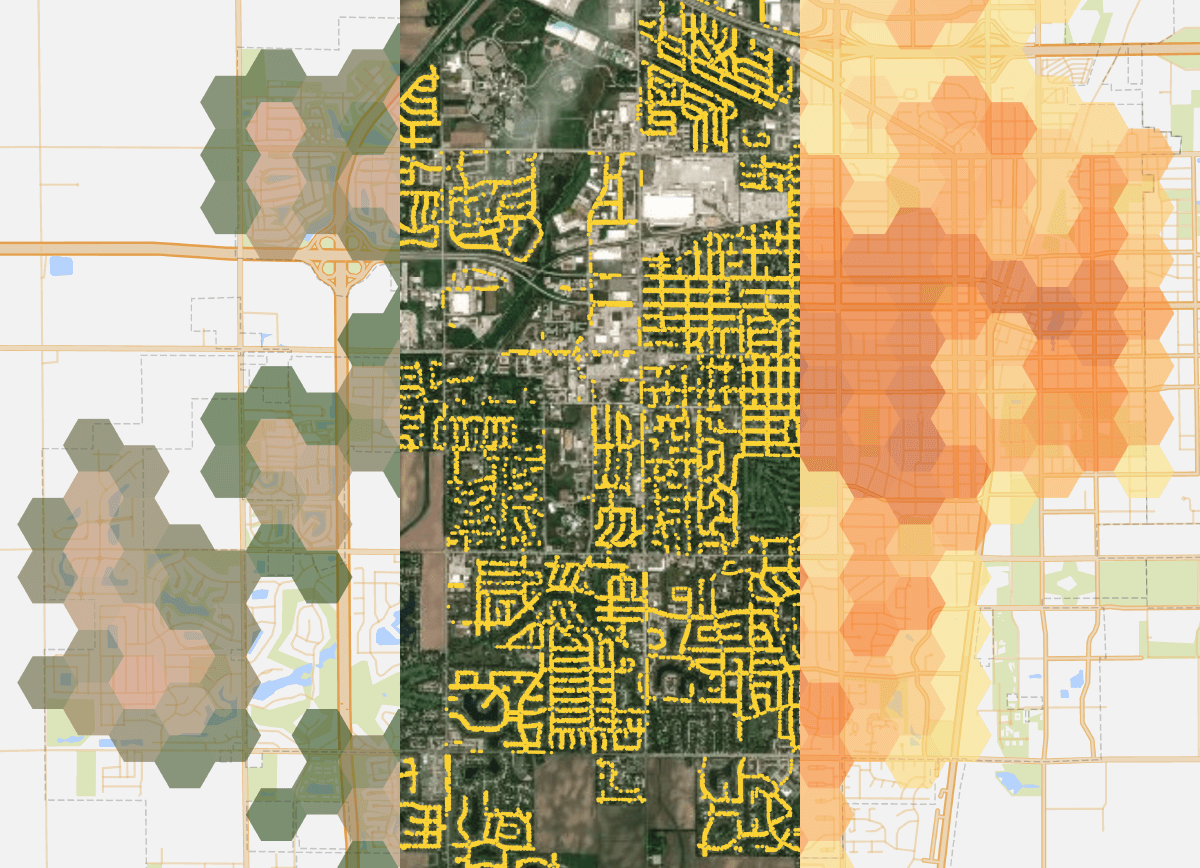
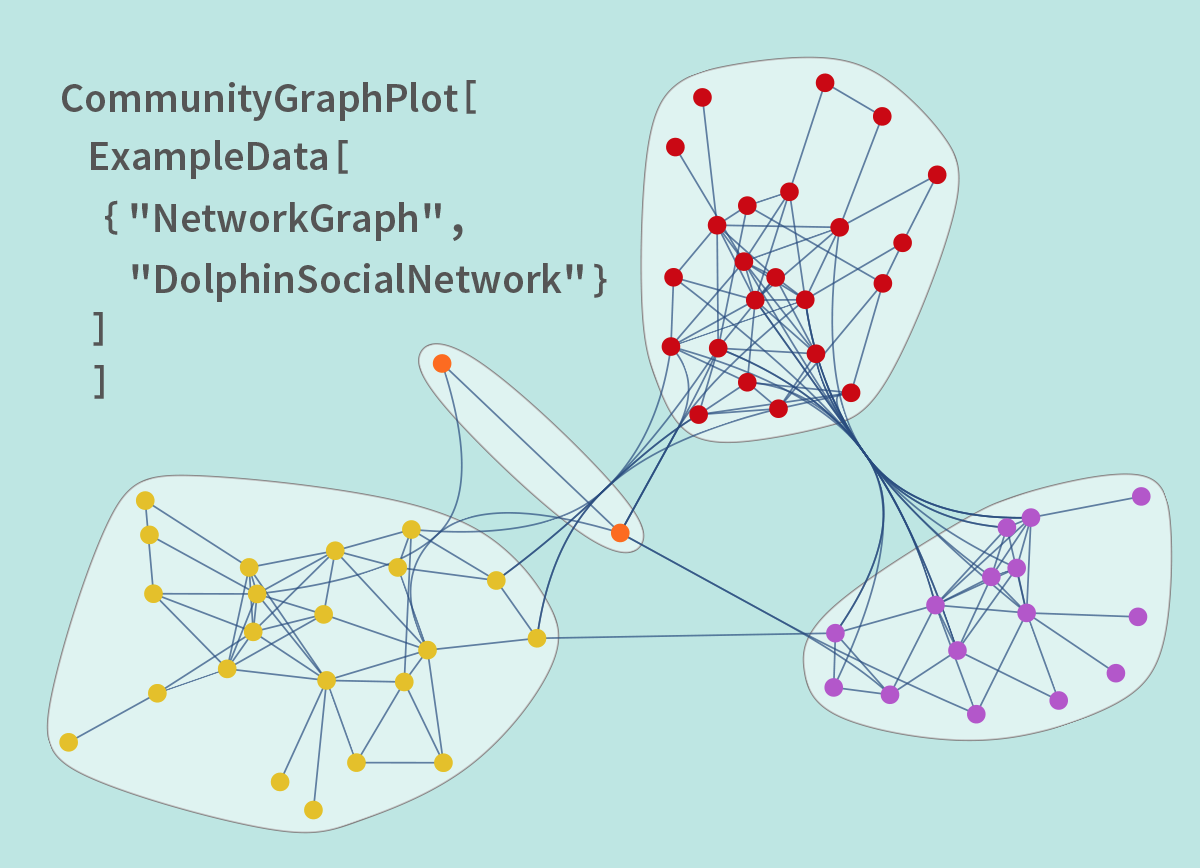
Computational Social Science with Wolfram Language
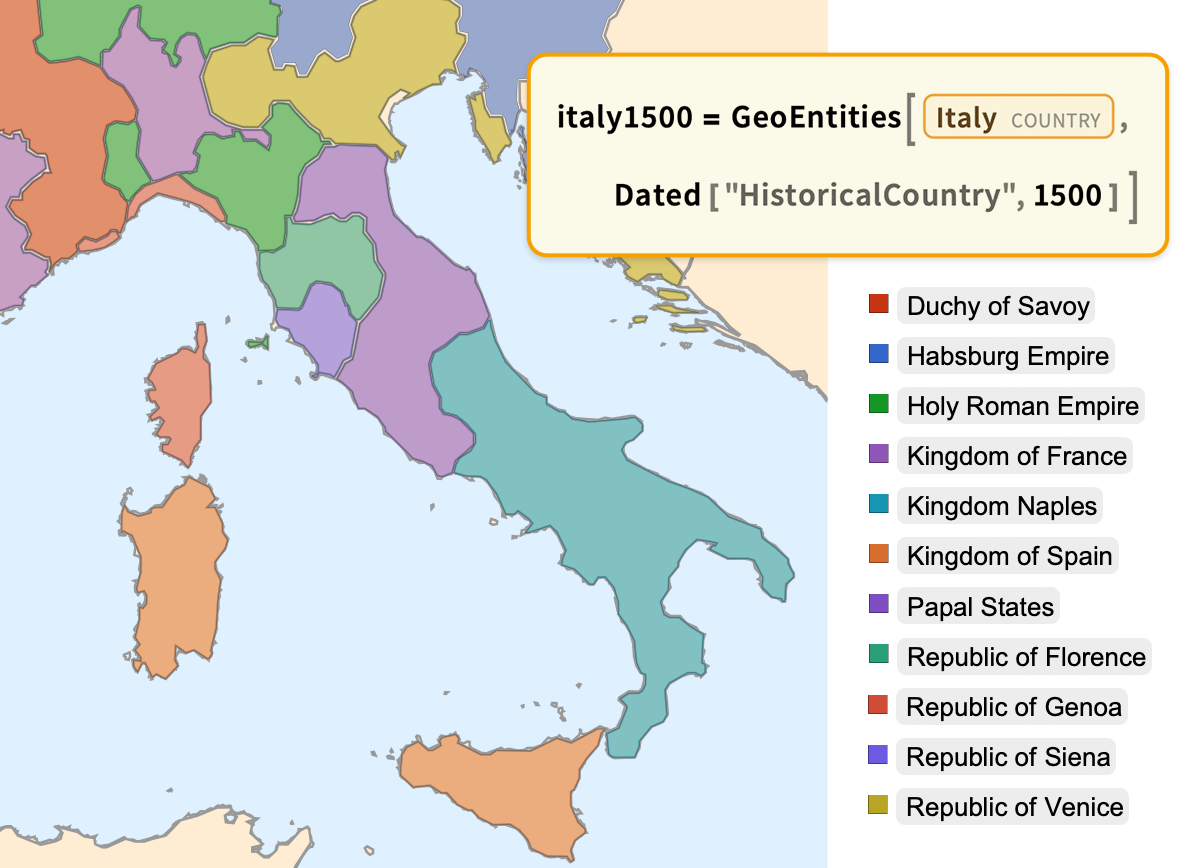
Computing Historical Geography
Convolutional Neural Networks for Computer Vision
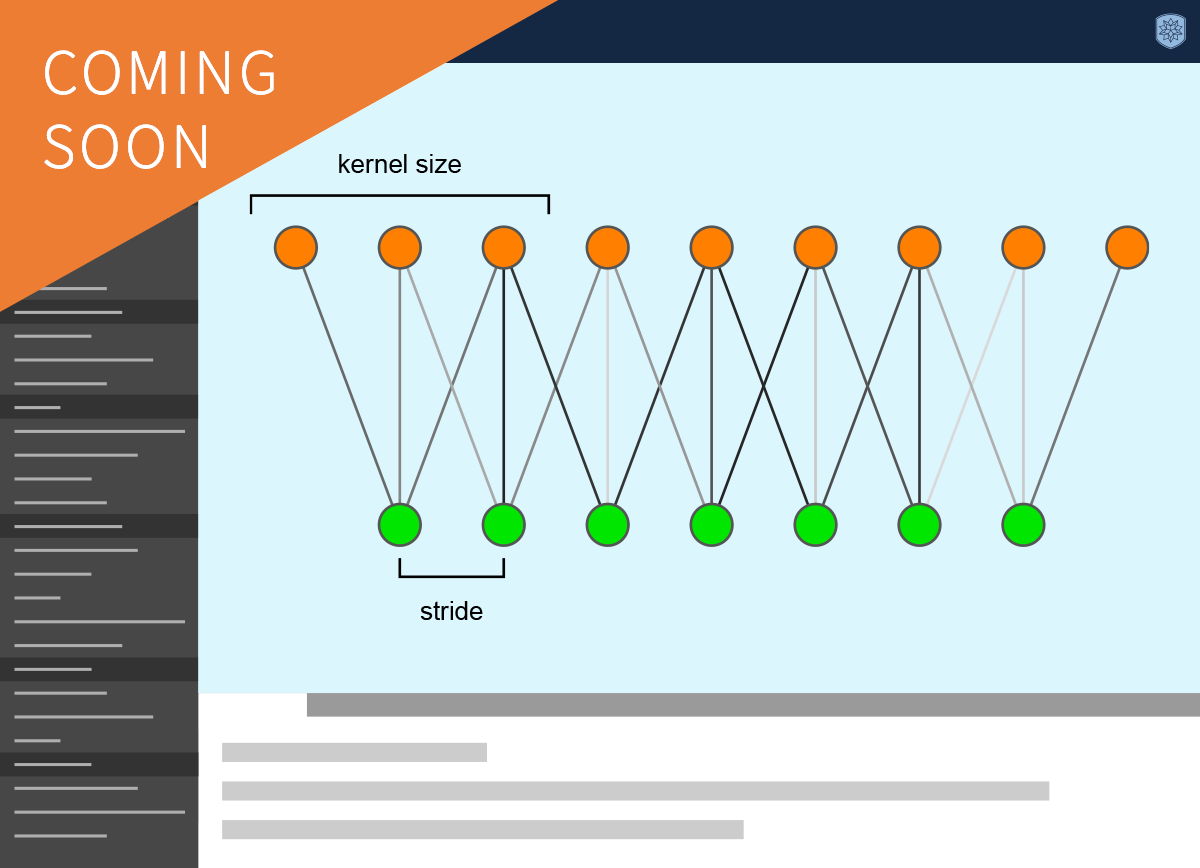
Daily Study Group: Convolutional Neural Networks for Computer Vision

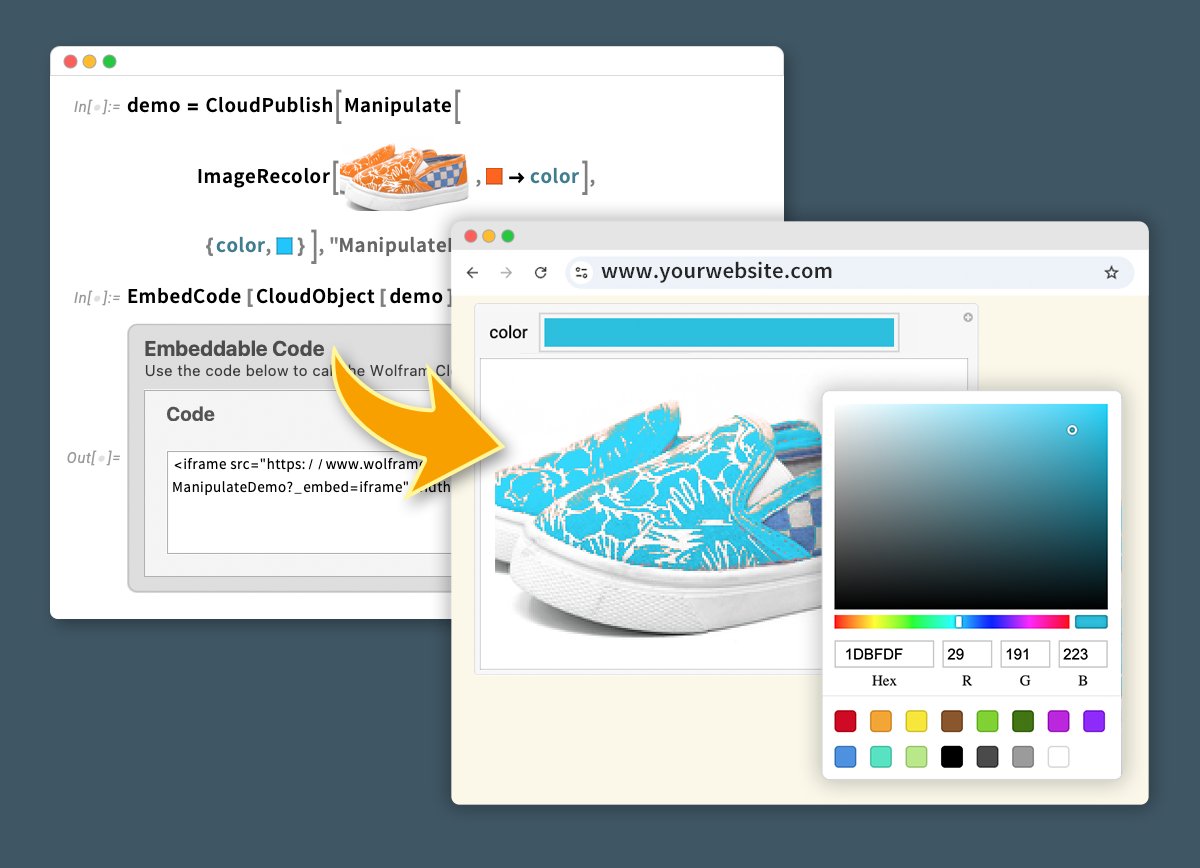
Deploying Ideas with Wolfram Notebooks
Emerald Cloud Lab: Powered by Wolfram Language
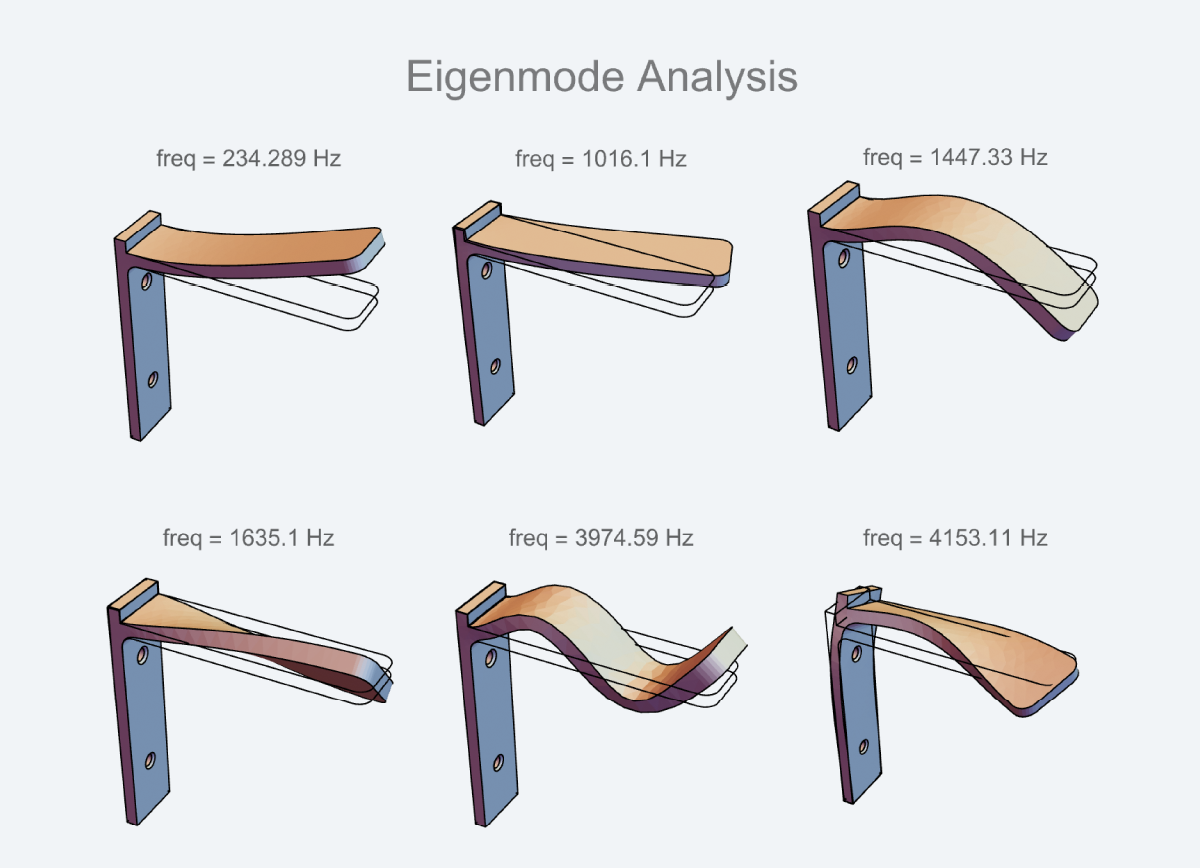
Engineering Computation with Wolfram Language
Exploring Wolfram Documentation Workflows
Introduction to Game Theory
Introduction to Partial Differential Equations
Mathematics Computation with Wolfram Language

Numeric PDE Solving over Regions
Using Wolfram Documentation

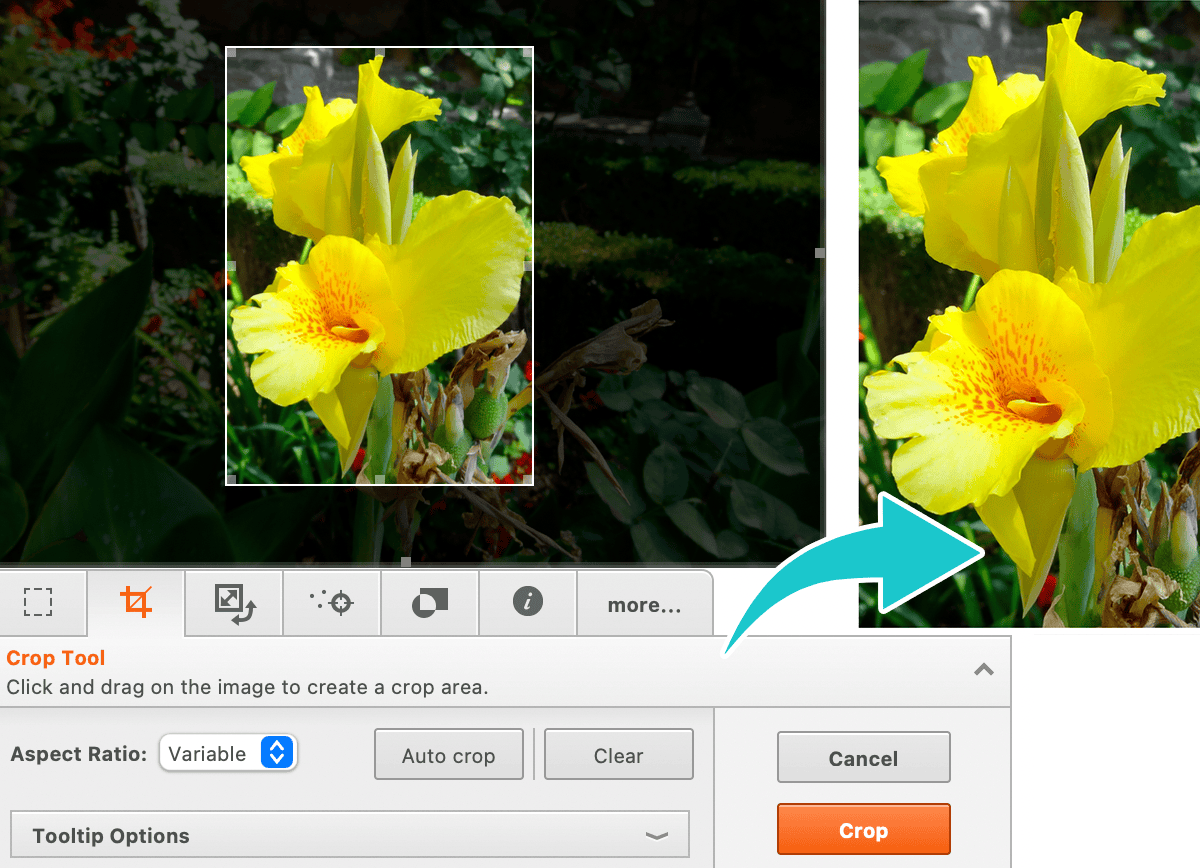
Video Creation, Editing and Analysis Using Wolfram Language

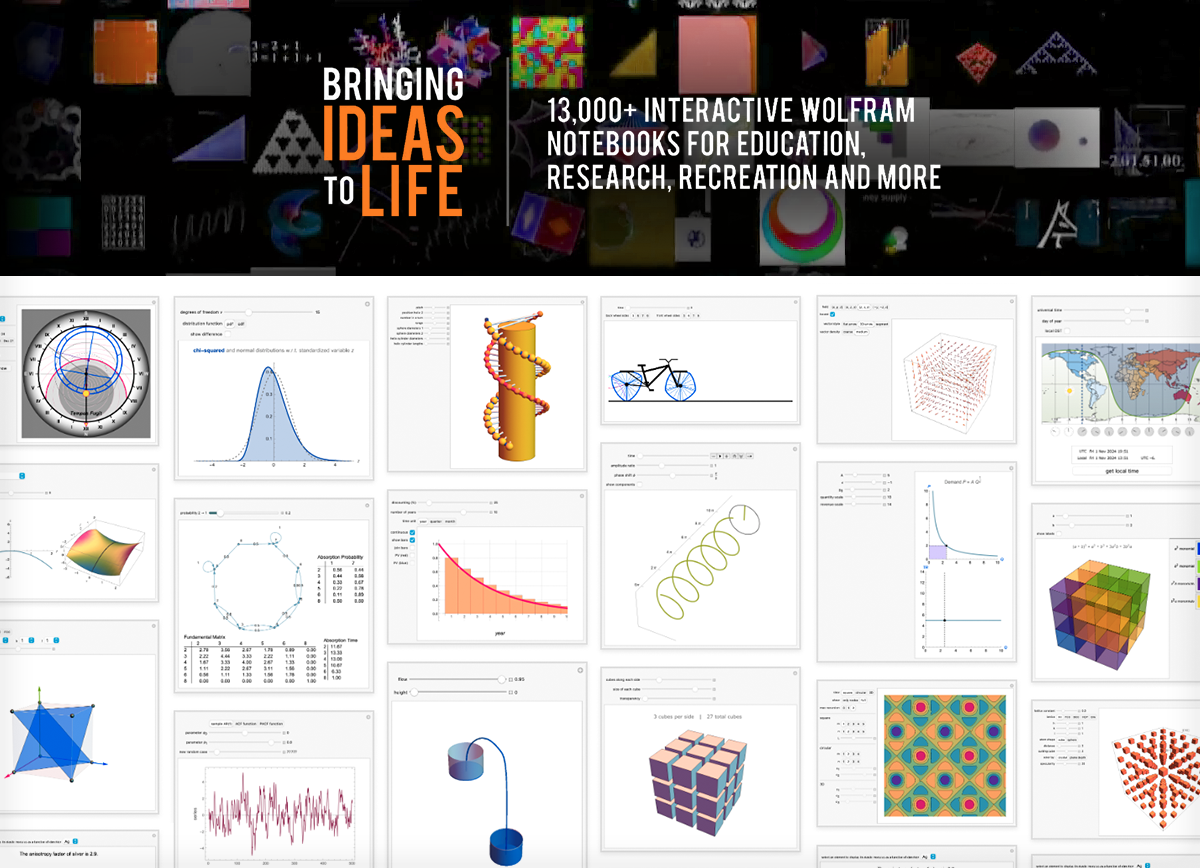
Wolfram Demonstrations Project
Computational Xplorations

Course Type
- Interactive Courses
- Video Lessons
- Video Courses
- Instructor-led Courses
- Archived and Special Events
Interactive Courses
Also known as MOOCs (massive open online courses), these courses are hosted on the Wolfram Cloud and allow you to interactively explore concepts using Wolfram Language functionality.
Self-paced with progress tracking
Include video lessons, exercises and problems, quizzes, exams and a scratch notebook
Sharable completion certificates available for all courses
Wolfram Level 1 proficiency certifications available for select courses
Video Lessons
Short recorded lessons that provide limited instruction on a computational topic or for using Wolfram tech.
Quick-start videos
Lessons from content experts
A wide variety of beginner-level lessons
Free to watch
Video Courses
Video series that build on preceding lessons to provide comprehensive instruction.
Each video course features a playlist of sequential lessons
Recorded by Wolfram certified instructors
Comprehensive coverage of a particular topic
Free to watch
Instructor-led Courses
Scheduled as online and in-person classes, these courses provide comprehensive instruction guided by a live instructor.
Registration required to reserve your seat
Taught by Wolfram certified instructors
Opportunity to pose live questions to experts in the room
Course completion certificates available
Archived and Special Events
Presentations by Wolfram developers, content experts and instructors.
Webinars on special topics and new release functionality
Livecoding sessions
Wolfram Daily Study Groups
Free to watch