This page requires that JavaScript be enabled in your browser.
Learn how »
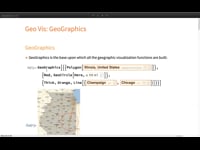
Data Visualization with the Wolfram Language Part 2
With the use of a curated dataset from the Wolfram Data Repository, this course shows how to quickly visualize different data structures and how to make your graphics ready to publish and share. Domain-specific functions as well as general techniques are shared for getting the most out of your graphics. The course is intended for anyone who wants to learn more about data visualization using the Wolfram Language.
Thanks for your feedback.
Channels: Virtual Events
701 videos match your search.
 |
Dylan Boliske & Andrew Steinacher |
 |
Aaron Enright |
 |
Abrita Chakravarty |
 |
Abrita Chakravarty |
 |
Tuseeta Banerjee |
 |
Chad Knutson |
 |
Cette deuxième partie de notre introduction à Mathematica est dédiée aux calculs mathématiques, à la visualisation et à linteractivité. Elle couvrira les nombres et la precision; le calcul ... |
 |
Chad Knutson |
 |
Chad Knutson |
 |
Cette premiere partie se focalise sur les principes fondamentaux du langage Wolfram et la syntaxe élémentaire. Vous apprendrez comment évaluer le langage, faire des affectations et définir des ... |
 |
Andrew Steinacher |
 |
Abrita Chakravarty |
 |
Brett Champion |
 |
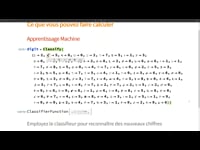
Etienne Bernard |
 |
Etienne Bernard |
 |
Etienne Bernard |
 |
Gosia Konwerska |
 |
Stephen Wolfram |
 |
|
 |
Christian Pasquel |
