This page requires that JavaScript be enabled in your browser.
Learn how »
Data Visualization with the Wolfram Language Part 2
With the use of a curated dataset from the Wolfram Data Repository, this course shows how to quickly visualize different data structures and how to make your graphics ready to publish and share. Domain-specific functions as well as general techniques are shared for getting the most out of your graphics. The course is intended for anyone who wants to learn more about data visualization using the Wolfram Language.
Thanks for your feedback.
Channels: Virtual Events
701 videos match your search.
 |
This live showcase demonstrates how Wolfram Technologies can be used in Calculus, Algebra, Statistics and other Maths-related subjects. It's scheduled specifically for students and faculty to help you use Mathematica and the Wolfram Language in your study, research ... |
 |
This live showcase demonstrates various Wolfram Technologies that can be used to help with the maths-based area of theoretical physics and the practical applications required for experimental physics. The Webinar ... |
 |
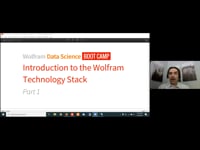
This course introduces core technologies for getting started quickly with the Wolfram Technology stack. Learn to work with Wolfram Notebooks in the ... |
 |
This course introduces core technologies for getting started quickly with the Wolfram Technology stack. Learn to work with Wolfram Notebooks in the ... |
 |
This course introduces core technologies for getting started quickly with the
Wolfram Technology stack. Learn to work with Wolfram Notebooks in the ... |
 |
Kelvin Mischo |
 |
Abrita Chakravarty |
 |
Jon McLoone |
 |
Abrita Chakravarty |
 |
Abrita Chakravarty |
 |
Mads Bahrami |
 |
Aaron Enright |
 |
Luke Titus |
 |
Luke Titus |
 |
Luke Titus |
 |
Abrita Chakravarty |
 |
Dylan Boliske and Jofre Espigule-Pons |
 |
Etienne Bernard |
 |
Tuseeta Banerjee |
 |
Damanjit Singh |
