This page requires that JavaScript be enabled in your browser.
Learn how »
Data Visualization with the Wolfram Language Part 2
With the use of a curated dataset from the Wolfram Data Repository, this course shows how to quickly visualize different data structures and how to make your graphics ready to publish and share. Domain-specific functions as well as general techniques are shared for getting the most out of your graphics. The course is intended for anyone who wants to learn more about data visualization using the Wolfram Language.
Thanks for your feedback.
Channels: Virtual Events
701 videos match your search.
 |
|
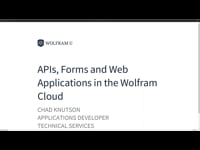 |
Chad Knutson This video shows how to create and deploy instant APIs and web forms with the Wolfram Language and how to develop web applications in the Wolfram Cloud. |
 |
Tuseeta Banerjee |
 |
Tuseeta Banerjee |
 |
Tuseeta Banerjee |
 |
Giulio Alessandrini |
 |
|
 |
Aprenda de manos de nuestros expertos la múltiples aplicaciones en la enseñanza y la investigación de SystemModeler, nuestra plataforma basada en Modelica para el modelado, simulación y análisis de sistemas. Su sistema drag-and-drop ... |
 |
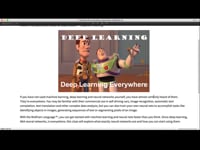
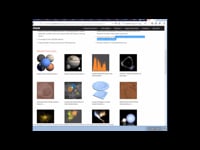
Vea el resumen sobre el aprendizaje automático en Mathematica 10 incluidas las funciones Classify y Predict. |
 |
Etienne Bernard |
 |
Etienne Bernard |
 |
Etienne Bernard |
 |
|
 |
|
 |
|
 |
Jeffrey Bryant |
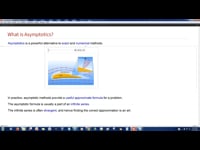 |
Devendra Kapadia This presentation gives some historical context and explanation of why asymptotics provide a powerful alternative to exact and numerical methods. Examples show the latest functions for asymptotic computations in the ... |
 |
Carlo Giacometti Learn about a suite of audio analysis and visualization functions available in the Wolfram Language. |
 |
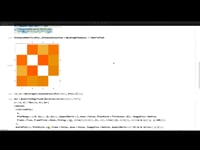
Shadi Ashnai Learn to modify audio signals using audio effects, including delay and reverberation.
Notebook link: https://wolfr.am/OKVe1Ef9 |
 |
|
