This page requires that JavaScript be enabled in your browser.
Learn how »
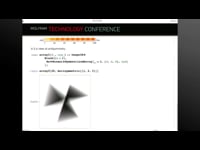
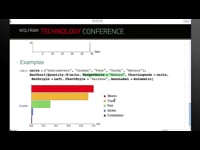
Gauges and Dashboards
Brett Champion
Highly customizable interactive gauges are part of Mathematica's collection of built-in visualizations. In this talk from the Wolfram Technology Conference, Brett Champion explains how the gauges work and shows use cases in dashboards, reports, and more.
Thanks for your feedback.
Channels: Wolfram Technology Conference 2012
42 videos match your search.
 |
Itai Seggev, Jose Martin-Garcia Itai Seggev and Jose Martin-Garcia walk through Mathematica's features for vector analysis and tensor algebra operations in this presentation from the Wolfram Technology Conference. |
 |
Brett Champion In this presentation from the Wolfram Technology Conference, Brett Champion gives an overview of Mathematica's latest visualization capabilities, including legends, gauges, and more. |
