‹›Cloud & Web InterfacesCache a Popular Weather Summary Webpage
If a Delayed cloud object is viewed by many people before it needs to be recomputed, its output can be cached for a period of time through the CachePersistence option.
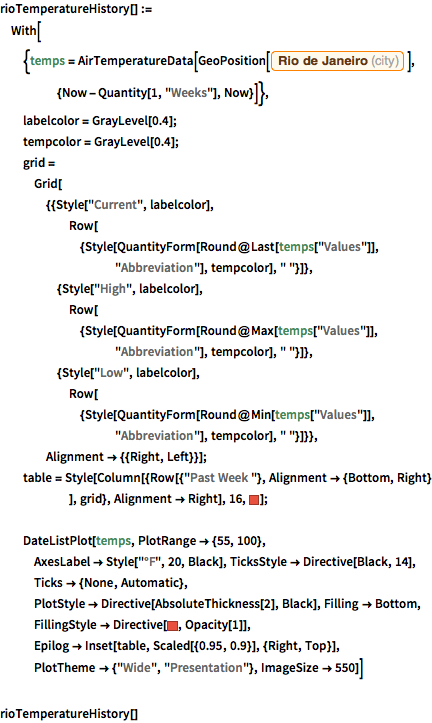
Define a function that computes temperature history for Rio de Janeiro the past week.
show complete Wolfram Language input
rioTemperatureHistory[] :=
 With[{temps =
    AirTemperatureData[
     GeoPosition[
      Entity["City", {"RioDeJaneiro", "RioDeJaneiro",
        "Brazil"}]], {Now - Quantity[1, "Weeks"], Now}]},
  labelcolor = GrayLevel[0.4];
  tempcolor = GrayLevel[0.4];
  grid = Grid[{{Style["Current", labelcolor],
      Row[{Style[
         QuantityForm[Round@Last[temps["Values"]], "Abbreviation"],
         tempcolor], " "}]}, {Style["High", labelcolor],
      Row[{Style[
         QuantityForm[Round@Max[temps["Values"]], "Abbreviation"],
         tempcolor], " "}]}, {Style["Low", labelcolor],
      Row[{Style[
         QuantityForm[Round@Min[temps["Values"]], "Abbreviation"],
         tempcolor], " "}]}}, Alignment -> {{Right, Left}}];
  table =
   Style[Column[{Row[{"Past Week "}, Alignment -> {Bottom, Right}
       ], grid}, Alignment -> Right], 16, RGBColor[
    0.9098049191388243, 0.3176450101594796, 0.24313742164725222`]];

  DateListPlot[temps, PlotRange -> {55, 100},
   AxesLabel -> Style["\[Degree]F", 20, Black],
   TicksStyle -> Directive[Black, 14], Ticks -> {None, Automatic},
   PlotStyle -> Directive[AbsoluteThickness[2], Black],
   Filling -> Bottom,
   FillingStyle ->
    Directive[RGBColor[
     0.9098049191388243, 0.3176450101594796, 0.24313742164725222`],
     Opacity[1]],
   Epilog -> Inset[table, Scaled[{0.95, 0.9}], {Right, Top}],
   PlotTheme -> {"Wide", "Presentation"}, ImageSize -> 550]]
rioTemperatureHistory[]Deploy the function as an application that caches its result for 5 minutes. Now thousands of users can access the application and get reasonably up-to-date information without the server having to recompute the result every time, resulting in better response time and lower server load.
obj = CloudDeploy[
  Delayed[rioTemperatureHistory[], "PNG",
   CachePersistence -> Quantity[5, "Minutes"]]]


