‹›클라우드 및 웹 인터페이스날씨 개요를 나타내는 대중적 웹 페이지 캐시에 저장하기
Delayed 클라우드 개체를 재계산이 요구되기 전에 다수의 사람들에 의해 열람되면 CachePersistence 옵션을 통해 출력을 일정 기간 캐시에 저장할 수있습니다.
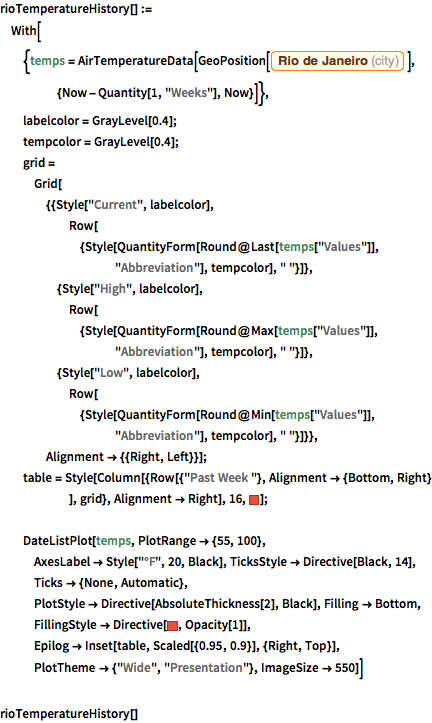
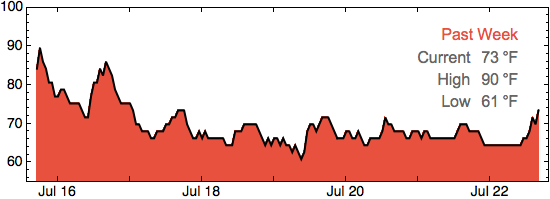
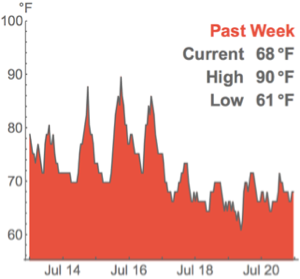
지난 주 리우데자네이루의 온도 이력을 계산하는 함수를 정의합니다.
전체 Wolfram 언어 입력 표시하기
rioTemperatureHistory[] :=
 With[{temps =
    AirTemperatureData[
     GeoPosition[
      Entity["City", {"RioDeJaneiro", "RioDeJaneiro",
        "Brazil"}]], {Now - Quantity[1, "Weeks"], Now}]},
  labelcolor = GrayLevel[0.4];
  tempcolor = GrayLevel[0.4];
  grid = Grid[{{Style["Current", labelcolor],
      Row[{Style[
         QuantityForm[Round@Last[temps["Values"]], "Abbreviation"],
         tempcolor], " "}]}, {Style["High", labelcolor],
      Row[{Style[
         QuantityForm[Round@Max[temps["Values"]], "Abbreviation"],
         tempcolor], " "}]}, {Style["Low", labelcolor],
      Row[{Style[
         QuantityForm[Round@Min[temps["Values"]], "Abbreviation"],
         tempcolor], " "}]}}, Alignment -> {{Right, Left}}];
  table =
   Style[Column[{Row[{"Past Week "}, Alignment -> {Bottom, Right}
       ], grid}, Alignment -> Right], 16, RGBColor[
    0.9098049191388243, 0.3176450101594796, 0.24313742164725222`]];

  DateListPlot[temps, PlotRange -> {55, 100},
   AxesLabel -> Style["\[Degree]F", 20, Black],
   TicksStyle -> Directive[Black, 14], Ticks -> {None, Automatic},
   PlotStyle -> Directive[AbsoluteThickness[2], Black],
   Filling -> Bottom,
   FillingStyle ->
    Directive[RGBColor[
     0.9098049191388243, 0.3176450101594796, 0.24313742164725222`],
     Opacity[1]],
   Epilog -> Inset[table, Scaled[{0.95, 0.9}], {Right, Top}],
   PlotTheme -> {"Wide", "Presentation"}, ImageSize -> 550]]
rioTemperatureHistory[]그 결과를 5분 동안 캐시에 저장하는 함수를 응용 프로그램으로 배포합니다. 이렇게 처리함으로 인해 서버는 매번 재계산을 하지 않고도 이 응용 프로그램에 액세스하는 수천명의 사용자에게 합리적인 수준의 최신 정보를 제공할 수 있으며, 결과적으로 반응시간은 빠르면서 서버 로드는 낮출 수 있습니다.
obj = CloudDeploy[
  Delayed[rioTemperatureHistory[], "PNG",
   CachePersistence -> Quantity[5, "Minutes"]]]