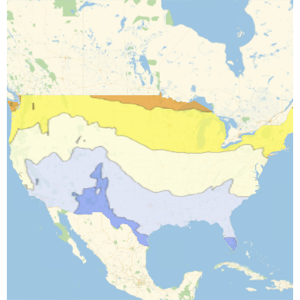
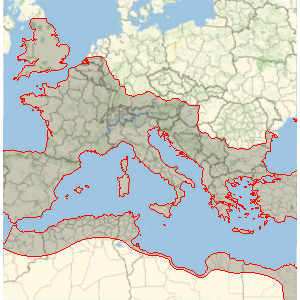
지구 해양의 상세 모델 조사
해수 염도의 깊이에 따라 표준 평균 35.2 g/kg에서 어떻게 변화 하는지 조사합니다.
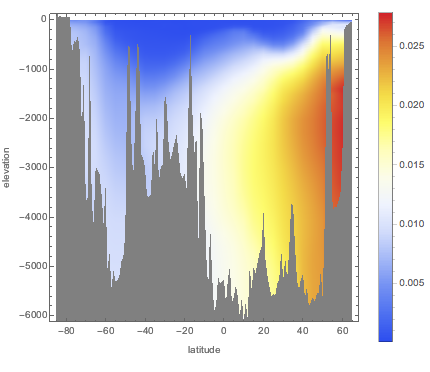
0미터에서 6000미터 깊이에 대해, 온도가 15 °C를 일정하게 유지한다고 가정하고, 동경 180°의 염분 편차 값의 배열을 계산합니다.
In[1]:=
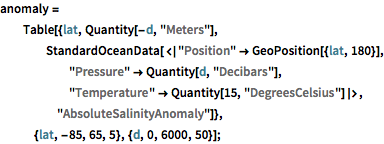
anomaly =
Table[{lat, Quantity[-d, "Meters"],
StandardOceanData[<|"Position" -> GeoPosition[{lat, 180}],
"Pressure" -> Quantity[d, "Decibars"],
"Temperature" -> Quantity[15, "DegreesCelsius"]|>,
"AbsoluteSalinityAnomaly"]},
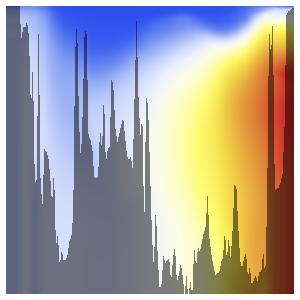
{lat, -85, 65, 5}, {d, 0, 6000, 50}];경도가 높은 지역에서 가장 큰 편차를 보입니다.
In[2]:=
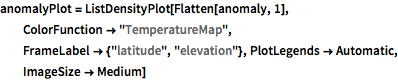
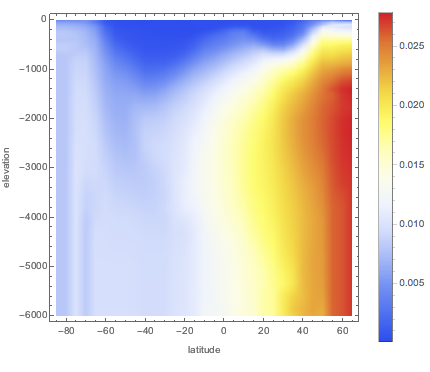
anomalyPlot =
 ListDensityPlot[Flatten[anomaly, 1],
  ColorFunction -> "TemperatureMap",
  FrameLabel -> {"latitude", "elevation"}, PlotLegends -> Automatic,
  ImageSize -> Medium]
Out[2]=
같은 경도의 해저에서 고도 통계 데이터를 겹쳐놓습니다.
전체 Wolfram 언어 입력 표시하기
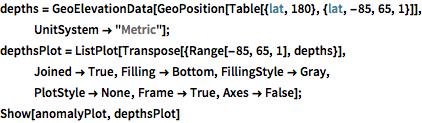
Out[3]=