Diseño de líneas de tiempo y colocación de etiquetas
Cree líneas de tiempo de personas famosas desde el período del Romanticismo.
In[1]:=
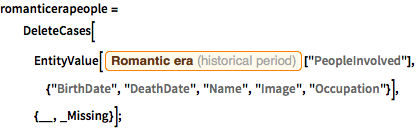
romanticerapeople =
  DeleteCases[
   EntityValue[
    Entity["HistoricalPeriod", "RomanticEra"][
     "PeopleInvolved"], {"BirthDate", "DeathDate", "Name", "Image",
     "Occupation"}], {__, _Missing}];
In[2]:=

lifespan =
  GroupBy[romanticerapeople,
   Last -> (Tooltip[
       Labeled[Interval@#[[1 ;; 2]], #[[3]], "StartBubble"],
       Labeled[#[[4]], DateDifference[#[[1]], #[[2]], "Year"]]] &)];
Muestre cada compositor en su propia fila.
In[3]:=
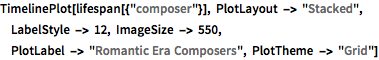
TimelinePlot[lifespan[{"composer"}], PlotLayout -> "Stacked",
 LabelStyle -> 12, ImageSize -> 550,
 PlotLabel -> "Romantic Era Composers", PlotTheme -> "Grid"]
Out[3]=
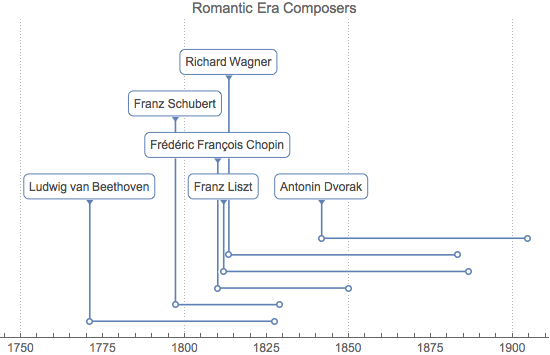
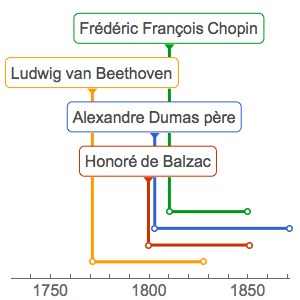
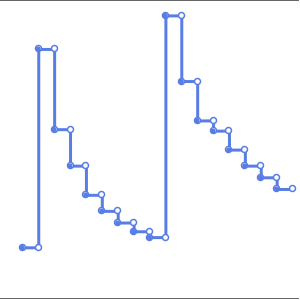
Utilice el número mínimo de filas.
In[4]:=
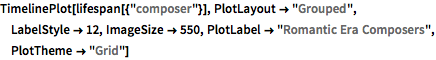
TimelinePlot[lifespan[{"composer"}], PlotLayout -> "Grouped",
 LabelStyle -> 12, ImageSize -> 550,
 PlotLabel -> "Romantic Era Composers", PlotTheme -> "Grid"]
Out[4]=
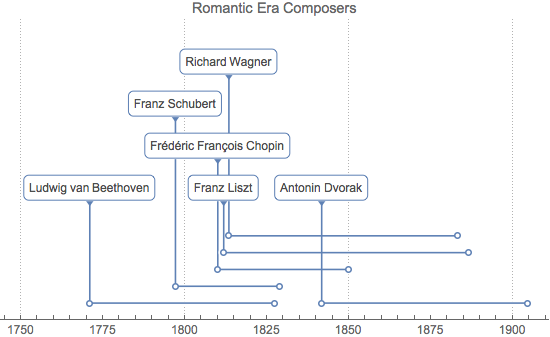
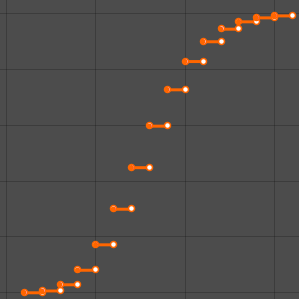
Coloque la etiqueta al final del intervalo de tiempo.
In[5]:=
lifespan =
GroupBy[romanticerapeople,
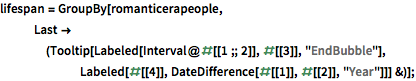
Last -> (Tooltip[
Labeled[Interval@#[[1 ;; 2]], #[[3]], "EndBubble"],
Labeled[#[[4]], DateDifference[#[[1]], #[[2]], "Year"]]] &)];In[6]:=
TimelinePlot[lifespan[{"composer"}], LabelStyle -> 12,
 ImageSize -> 550, PlotLabel -> "Romantic Era Composers",
 PlotTheme -> "Grid"]
Out[6]=
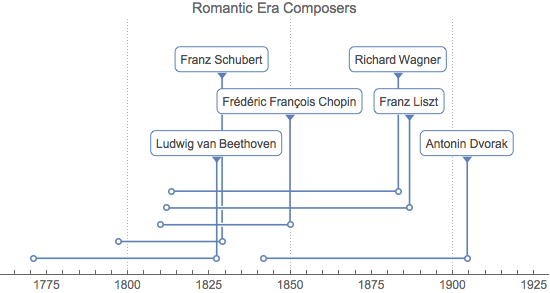
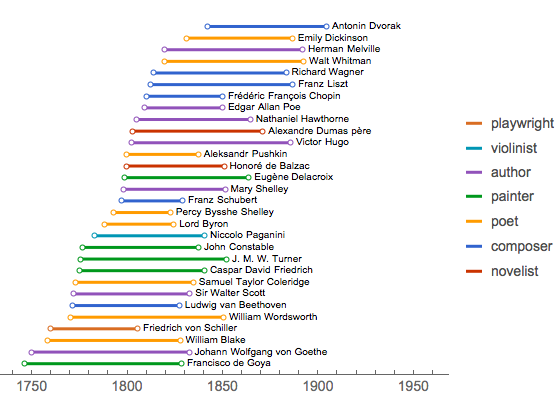
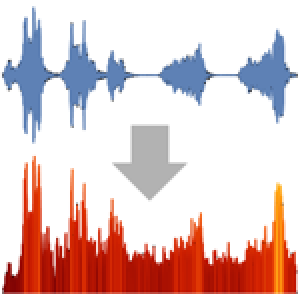
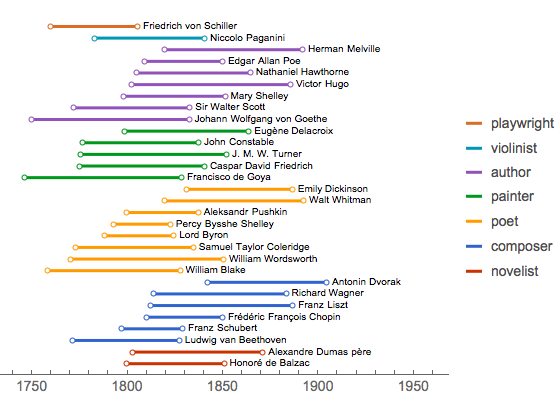
Cuando hay muchas entradas de datos y espacio limitado, coloque las etiquetas después de los intervalos.
In[7]:=
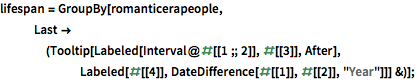
lifespan =
  GroupBy[romanticerapeople,
   Last -> (Tooltip[Labeled[Interval@#[[1 ;; 2]], #[[3]], After],
       Labeled[#[[4]], DateDifference[#[[1]], #[[2]], "Year"]]] &)];
In[8]:=
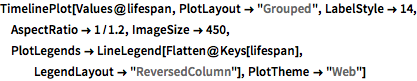
TimelinePlot[Values@lifespan, PlotLayout -> "Grouped",
 LabelStyle -> 14, AspectRatio -> 1/1.2, ImageSize -> 450,
 PlotLegends ->
  LineLegend[Flatten@Keys[lifespan],
   LegendLayout -> "ReversedColumn"], PlotTheme -> "Web"]
Out[8]=
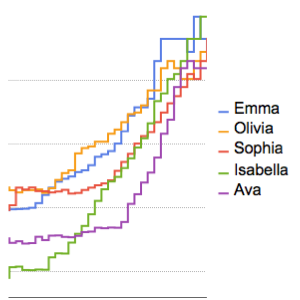
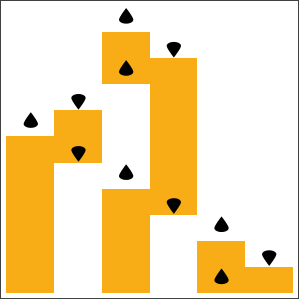
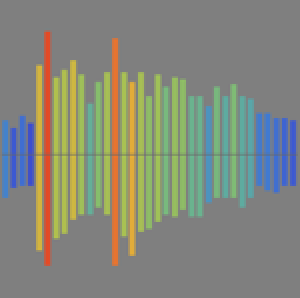
Utilice un diseño compacto en todos los conjuntos de datos.
In[9]:=
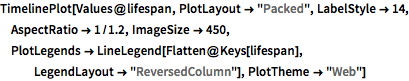
TimelinePlot[Values@lifespan, PlotLayout -> "Packed",
 LabelStyle -> 14, AspectRatio -> 1/1.2, ImageSize -> 450,
 PlotLegends ->
  LineLegend[Flatten@Keys[lifespan],
   LegendLayout -> "ReversedColumn"], PlotTheme -> "Web"]
Out[9]=