数量データのノンパラメトリック分布
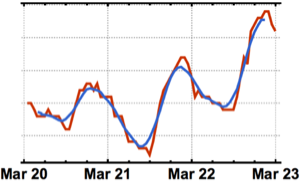
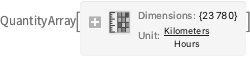
WeatherDataを使って,2014年の初めから2015年の終りまでにシカゴの町で測定した風速の時系列を得る.
In[1]:=
wsts = WeatherData["Chicago",
  "WindSpeed", {DateObject[{2014, 1, 1}], DateObject[{2015, 12, 31}]}]
Out[1]=
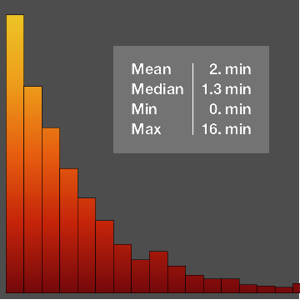
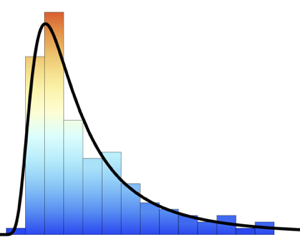
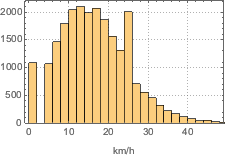
Histogramを使って風速の分布を可視化する.
In[2]:=
Histogram[wsts, PlotTheme -> "Detailed", FrameLabel -> Automatic]Out[2]=
欠測値を補間して,風速値を抽出する.
In[3]:=
winds = Values[TimeSeries[wsts, MissingDataMethod -> "Interpolation"]]Out[3]=
SmoothKernelDistributionを使い,風速が非負であるようにして,シカゴにおける風速のノンパラメトリックモデルを構築する.
In[4]:=
ws\[ScriptCapitalD] =
 SmoothKernelDistribution[winds,
  Automatic, {"Bounded", Quantity[0, ("Kilometers")/("Hours")],
   "Gaussian"}]
Out[4]=
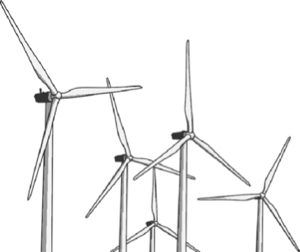
タービンの電力出力のノンパラメトリックモデルを風速の関数として使い,その場所に設置されたGE 1.5 MWの風タービンの平均電力出力を推定する.
In[5]:=
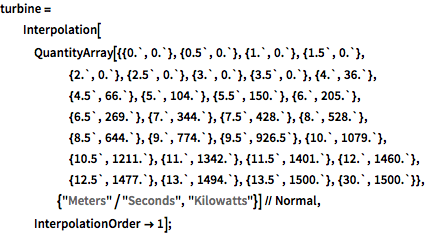
turbine =
  Interpolation[
   QuantityArray[{{0.`, 0.`}, {0.5`, 0.`}, {1.`, 0.`}, {1.5`,
       0.`}, {2.`, 0.`}, {2.5`, 0.`}, {3.`, 0.`}, {3.5`, 0.`}, {4.`,
       36.`}, {4.5`, 66.`}, {5.`, 104.`}, {5.5`, 150.`}, {6.`,
       205.`}, {6.5`, 269.`}, {7.`, 344.`}, {7.5`, 428.`}, {8.`,
       528.`}, {8.5`, 644.`}, {9.`, 774.`}, {9.5`, 926.5`}, {10.`,
       1079.`}, {10.5`, 1211.`}, {11.`, 1342.`}, {11.5`,
       1401.`}, {12.`, 1460.`}, {12.5`, 1477.`}, {13.`,
       1494.`}, {13.5`, 1500.`}, {30.`, 1500.`}}, {"Meters"/"Seconds",
       "Kilowatts"}] // Normal, InterpolationOrder -> 1];
In[6]:=
NExpectation[turbine[v], v \[Distributed] ws\[ScriptCapitalD]]Out[6]=