世界の原子炉
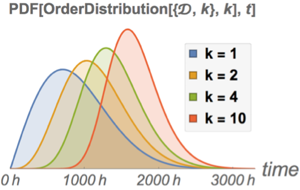
NuclearReactorDataは,世界中の既知の原子炉についてのデータを提供する.このデータには,チェルノブイリ原発のようにすでに閉鎖されたものも含まれている.核エネルギー資源について解析するには,現在稼働中の原子炉を選べばよい.
In[1]:=
reactors = NuclearReactorData[];In[2]:=
active = Keys@
   Select[EntityValue["NuclearReactor", "Status",
     "EntityAssociation"], # === "operational" &];
年間のエネルギー生産量と原子炉の所在国を抽出する.
In[3]:=
annualproduction =
  NuclearReactorData[active, "AnnualEnergyProduction"];
countries = Map[First, NuclearReactorData[active, "Countries"]];
データ集合を作成し,欠測値のあるデータ点を取り除く.稼働中の原子炉の数は400を超える.
In[4]:=
data = Transpose[{active, countries, annualproduction}];
data = DeleteMissing[data, 1, 2];
In[5]:=
data // DimensionsOut[5]=
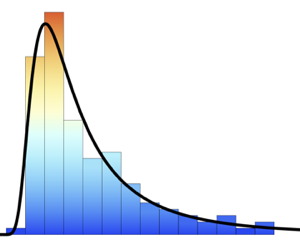
国ごとの原子炉の数.
In[6]:=
percountry = GroupBy[data, #1[[2]] &];In[7]:=
numberpercountry = Map[Length, percountry];In[8]:=
BarChart[Sort[numberpercountry], ChartLabels -> Automatic,
 ChartStyle -> "DarkRainbow", BarOrigin -> Left, BarSpacing -> 1,
 LabelingFunction -> (Placed[#1, After] &), ImageSize -> Large]
Out[8]=
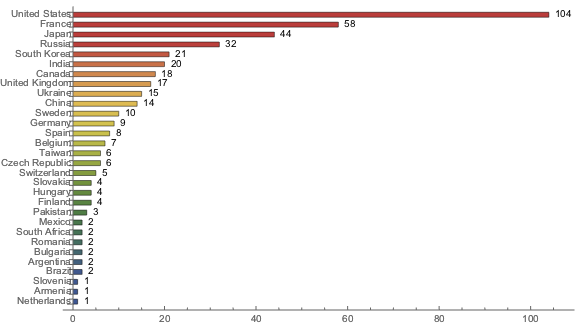
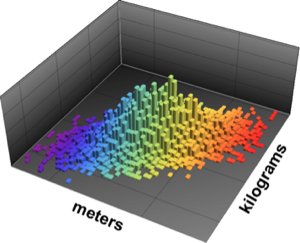
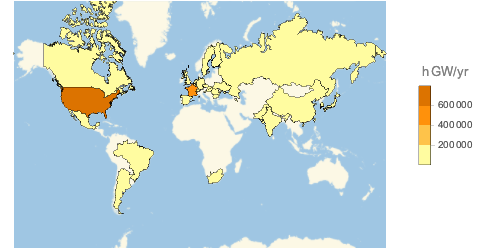
原子炉の数は,各国で生産される核エネルギー総量に対応する.
In[9]:=
energytotals = Map[Total[#[[All, 3]]] &, percountry];In[10]:=
stats = {Min, Max, Mean, Median, Total};
TableForm[#[energytotals] & /@ stats, TableHeadings -> {stats}]
Out[10]//TableForm=
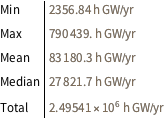
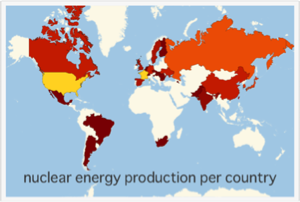
核エネルギーの最大生産国は,アメリカ合衆国とフランスである.
In[11]:=
TakeLargest[energytotals, 2]Out[11]=
完全なWolfram言語入力を表示する
Out[12]=
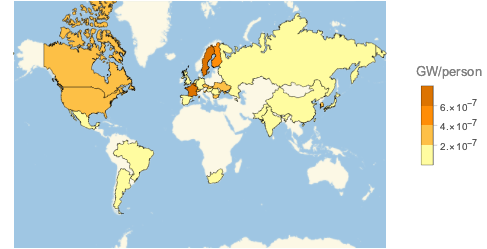
国民1人当たりのエネルギーの総生産量を考慮すると,結果の地図は異なるものになる.CountryDataを使って,リストの各国の総人口を得る.
In[13]:=
populations =
  AssociationThread[Keys[energytotals],
   CountryData[#, "Population"] & /@ Keys[energytotals]];
国民1人当たりの核エネルギーを計算する.
In[14]:=
energypercapita = energytotals/populations;In[15]:=
TableForm[#[energypercapita] & /@ stats, TableHeadings -> {stats}]Out[15]//TableForm=
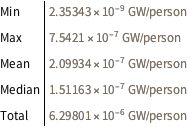
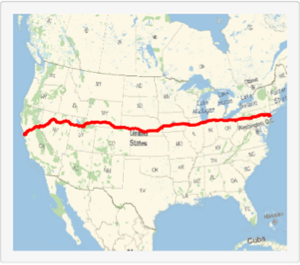
アメリカ合衆国は核エネルギーの絶対生産量では最大であるが,国民1人当たりの生産量では最大ではないことが地図から分かる.国民1人当たりの生産量が最大なのは,フランスとスウェーデンである.
In[16]:=
TakeLargest[energypercapita, 2]Out[16]=
完全なWolfram言語入力を表示する
Out[17]=