세계의 원자로
NuclearReactorData는 전세계에 잘 알려진 원자로에 대한 데이터를 제공합니다. 이 데이터는 체르노빌 원전처럼 이미 폐쇄 된 것도 포함하고 있습니다. 핵 에너지 자원에 대한 분석은 현재 운행중인 원자로를 선택하여 진행합니다.
In[1]:=
reactors = NuclearReactorData[];In[2]:=
active = Keys@
Select[EntityValue["NuclearReactor", "Status",
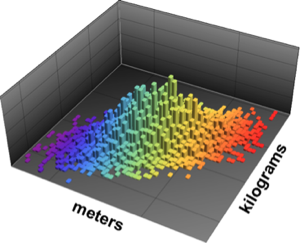
"EntityAssociation"], # === "operational" &];연간 에너지 생산량 및 원자로의 소재국을 추출합니다.
In[3]:=
annualproduction =
  NuclearReactorData[active, "AnnualEnergyProduction"];
countries = Map[First, NuclearReactorData[active, "Countries"]];
데이터 집합을 만들고 결측치가있는 데이터 점을 제거합니다. 운행중인 원자로의 수는 400대가 넘습니다.
In[4]:=
data = Transpose[{active, countries, annualproduction}];
data = DeleteMissing[data, 1, 2];
In[5]:=
data // DimensionsOut[5]=
국가별 원자로의 수를 살펴봅니다.
In[6]:=
percountry = GroupBy[data, #1[[2]] &];In[7]:=
numberpercountry = Map[Length, percountry];In[8]:=
BarChart[Sort[numberpercountry], ChartLabels -> Automatic,
 ChartStyle -> "DarkRainbow", BarOrigin -> Left, BarSpacing -> 1,
 LabelingFunction -> (Placed[#1, After] &), ImageSize -> Large]
Out[8]=
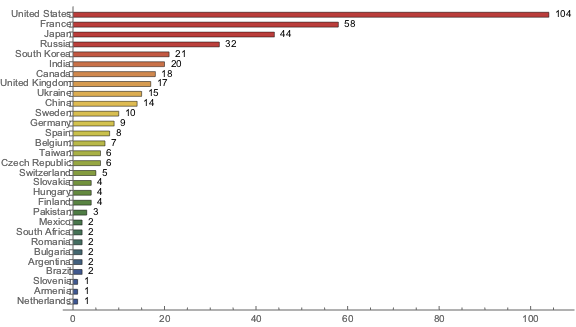
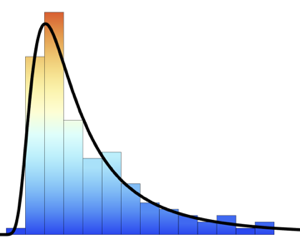
국가별 생산 된 핵 에너지 총량에 해당하는 원자로의 수를 알아봅니다.
In[9]:=
energytotals = Map[Total[#[[All, 3]]] &, percountry];In[10]:=
stats = {Min, Max, Mean, Median, Total};
TableForm[#[energytotals] & /@ stats, TableHeadings -> {stats}]
Out[10]//TableForm=
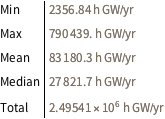
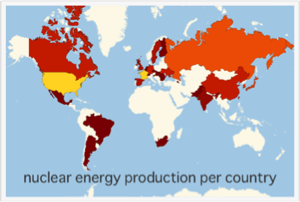
핵 에너지 최대 생산국은 미국과 프랑스입니다.
In[11]:=
TakeLargest[energytotals, 2]Out[11]=
전체 Wolfram 언어 입력 표시하기
Out[12]=
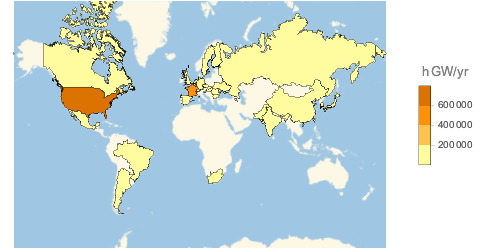
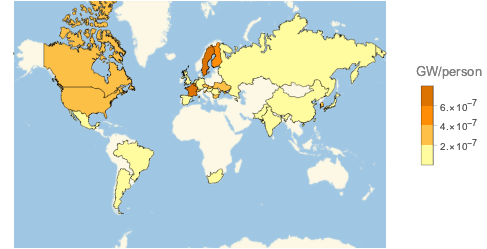
국민 1인당 에너지 총 생산량을 고려하면 결과 지도는 다른 것이 됩니다. CountryData를 사용하여 목록상의 각국 인구를 얻습니다.
In[13]:=
populations =
  AssociationThread[Keys[energytotals],
   CountryData[#, "Population"] & /@ Keys[energytotals]];
국민 1인당 핵 에너저를 계산합니다.
In[14]:=
energypercapita = energytotals/populations;In[15]:=
TableForm[#[energypercapita] & /@ stats, TableHeadings -> {stats}]Out[15]//TableForm=
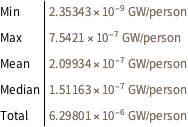
미국은 핵 에너지의 절대 생산량 최대국이지만, 국민 1인당 생산량은 최대가 아님을 이 지도를 통해 알 수있습니다. 프랑스와 스웨덴이 최대값을 가지는 것을 볼수있습니다.
In[16]:=
TakeLargest[energypercapita, 2]Out[16]=
전체 Wolfram 언어 입력 표시하기
Out[17]=