「スーパーフード」を分析,可視化,比較する
スーパーフードとは,ある栄養素(複数可)の含有量が非常に高い食物のことである.この例では,スーパーフードの集合を定義し,Wolfram Knowledgebaseの食品データを使ってより「典型的」な食品と比較する.最後に,「スーパー」という名前に値する食品にふさわしい徽章を作成する.
まず,スーパーフードとそれが含んでいることで有名な栄養素のリストを定義する.
In[1]:=
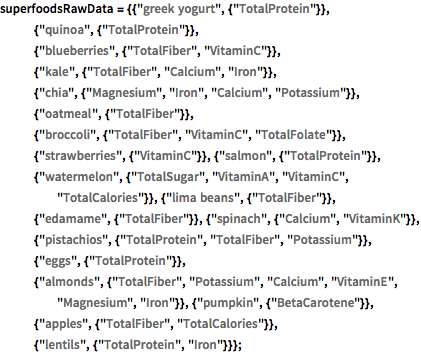
superfoodsRawData = {{"greek yogurt", {"TotalProtein"}}, {"quinoa", \
{"TotalProtein"}}, {"blueberries", {"TotalFiber",
     "VitaminC"}}, {"kale", {"TotalFiber", "Calcium",
     "Iron"}}, {"chia", {"Magnesium", "Iron", "Calcium",
     "Potassium"}}, {"oatmeal", {"TotalFiber"}}, {"broccoli", \
{"TotalFiber", "VitaminC",
     "TotalFolate"}}, {"strawberries", {"VitaminC"}}, {"salmon", \
{"TotalProtein"}}, {"watermelon", {"TotalSugar", "VitaminA",
     "VitaminC", "TotalCalories"}}, {"lima beans", {"TotalFiber"}},
   {"edamame", {"TotalFiber"}}, {"spinach", {"Calcium",
     "VitaminK"}}, {"pistachios", {"TotalProtein", "TotalFiber",
     "Potassium"}}, {"eggs", {"TotalProtein"}}, {"almonds", \
{"TotalFiber", "Potassium", "Calcium", "VitaminE", "Magnesium",
     "Iron"}}, {"pumpkin", {"BetaCarotene"}}, {"apples", \
{"TotalFiber", "TotalCalories"}}, {"lentils", {"TotalProtein",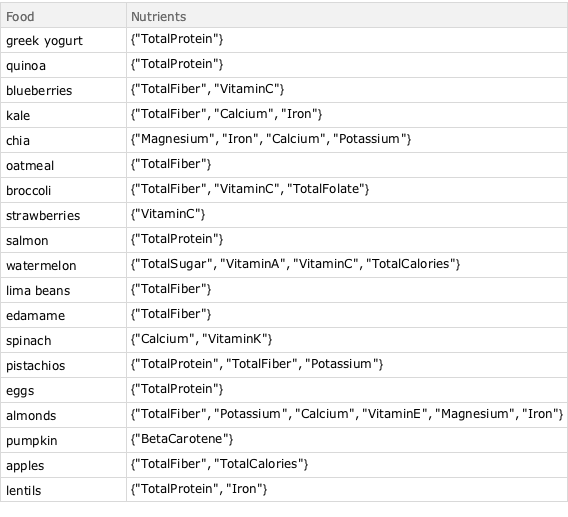
"Iron"}}};計算に便利なようにDatasetに変換する.
In[2]:=
superfoodsDatset =
 Dataset[<|"Food" -> #1, "Nutrients" -> #2|> & @@@ superfoodsRawData]
Out[2]=
Interpreterを使ってこのスーパーフードに対応するWolfram言語の実体を取り出す.
In[3]:=
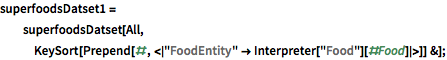
superfoodsDatset1 =
  superfoodsDatset[All,
   KeySort[Prepend[#, <|
       "FoodEntity" -> Interpreter["Food"][#Food]|>]] &];
栄養素をリストにする.
In[4]:=
Union @@ Normal[superfoodsDatset1[[All, "Nutrients"]]]Out[4]=
指定された栄養素を適切な特性に変換する規則を作る.
In[5]:=
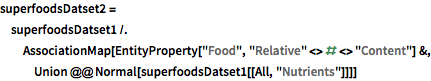
superfoodsDatset2 =
 superfoodsDatset1 /.
  AssociationMap[
   EntityProperty["Food", "Relative" <> # <> "Content"] &,
   Union @@ Normal[superfoodsDatset1[[All, "Nutrients"]]]]
Out[5]=
Datasetで最も頻度の高い栄養素を求める.
In[6]:=
mostCommonProperties =
 superfoodsDatset2[Counts[Flatten[#]] &, "Nutrients"][TakeLargest[5]]
Out[6]=
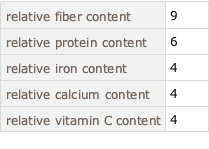
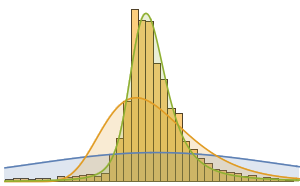
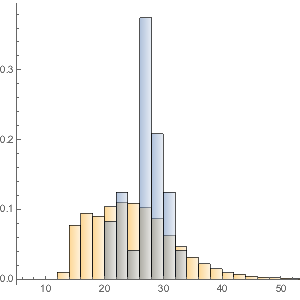
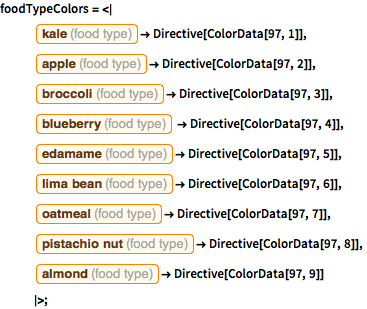
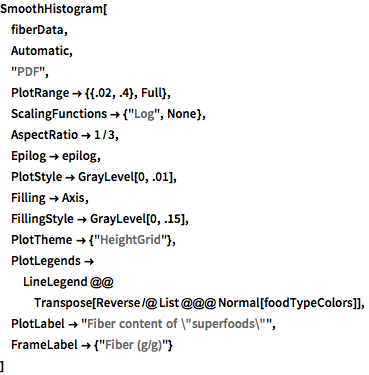
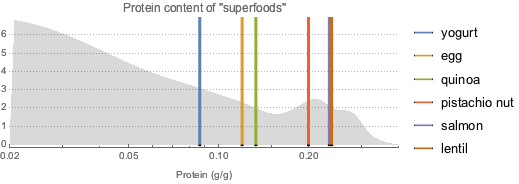
食物繊維に富むことで有名なスーパーフードを求め,およそ9000種類の他の食品と比較し,平滑化ヒストグラムとして可視化する.灰色の曲線はほとんどの食品の食物繊維の確率密度関数を表している.
In[7]:=
fiberDataset =
  superfoodsDatset2[
   Select[ContainsAny[#Nutrients, {EntityProperty["Food",
        "RelativeTotalFiberContent"]}] &], KeyDrop["Nutrients"]];
完全なWolfram言語入力を表示する
Out[13]=
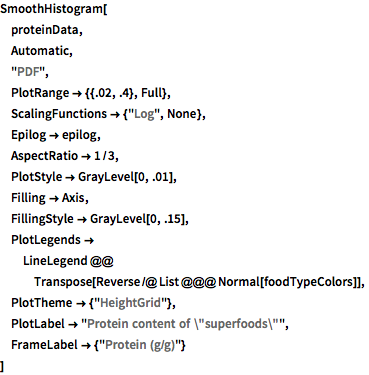
タンパク質に富むスーパーフードについても同様のことを行う.
In[14]:=
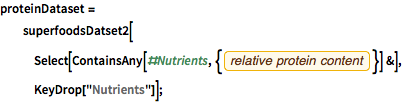
proteinDataset =
  superfoodsDatset2[
   Select[ContainsAny[#Nutrients, {EntityProperty["Food",
        "RelativeTotalProteinContent"]}] &], KeyDrop["Nutrients"]];
完全なWolfram言語入力を表示する
Out[21]=
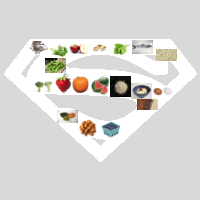
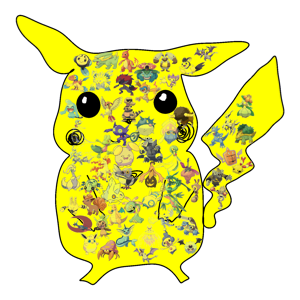
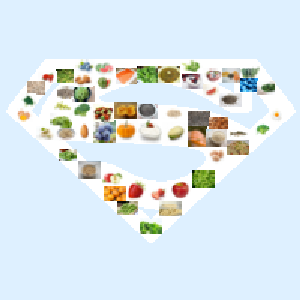
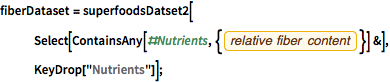
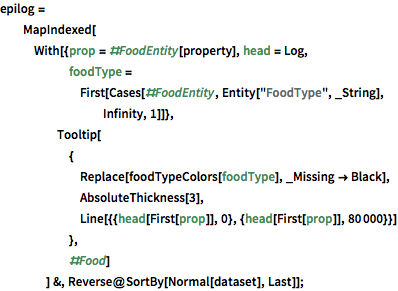
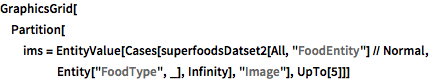
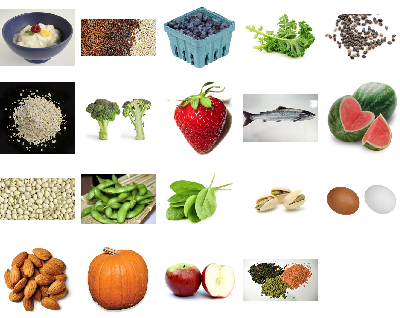
スーパーフードの徽章を作る.まず,スーパーフードの画像集合から始める.
In[22]:=
GraphicsGrid[
 Partition[
  ims = EntityValue[
    Cases[superfoodsDatset2[All, "FoodEntity"] // Normal,
     Entity["FoodType", _], Infinity], "Image"], UpTo[5]]]
Out[22]=
背景として,よく知られているスーパーマンの形を使う.
In[23]:=
Entity["Lamina", "SupermanInsigniaLamina"]["Image"] // ImageCropOut[23]=

簡単な画像処理を使ってこれを背景に変換する.
In[24]:=
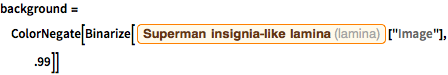
background =
 ColorNegate[
  Binarize[Entity["Lamina", "SupermanInsigniaLamina"]["Image"], .99]]
Out[24]=

スーパーフードの「ワードクラウド」を作る.
In[25]:=
wc = WordCloud[(RandomReal[{0.6, 1.2}] -> #) & /@ ims, background]Out[25]=
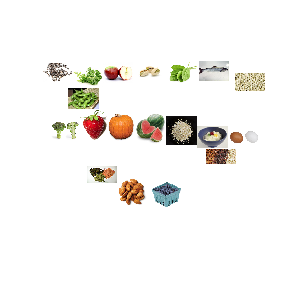
このワードクラウドを背景と組み合せる.
In[26]:=
ImageMultiply[{ColorReplace[background, Black -> LightGray], wc}]Out[26]=